
In case you missed them, this Maptitude Blog looks at the best LinkedIn Maptitude posts from the last month. We explore current topics in the news and how they can be explored with Maptitude. The applications range from site location analysis, sales territories, franchises, economic growth, and housing supply. Read on to learn how Maptitude mapping software can benefit your organization with map-driven insights and actionable results.

An analysis by Brett
Lucas using #Maptitude
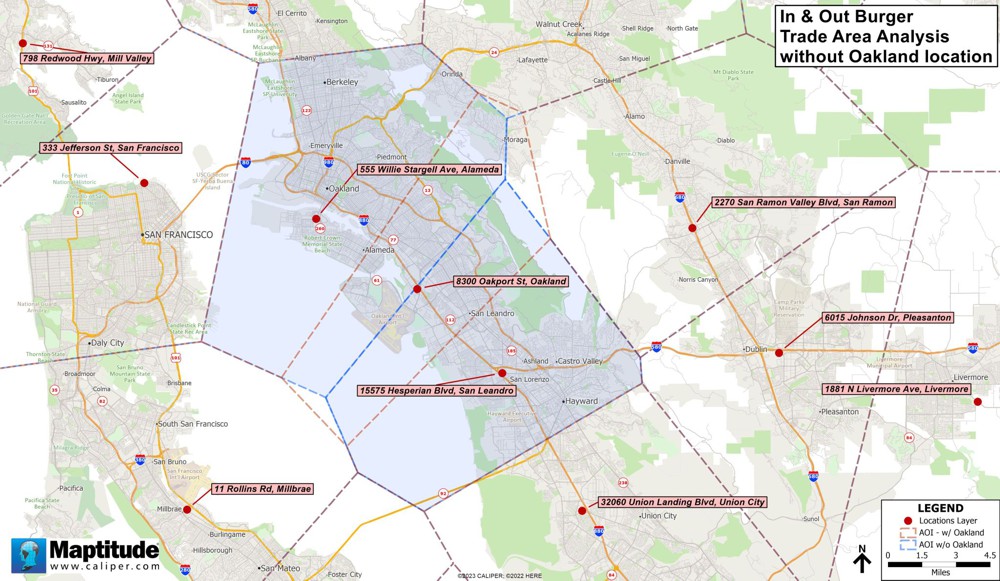
This post maps out the impact of the In-N-Out Burger announcement in January 2024 that it will close a location for the first time in its 75-year history. The company cited several ongoing crime issues, including car break-ins, property damage, theft, and armed robberies, as reasons for the closure (See also, "Using Maps to Understand the Impact of Organized Retail Theft").
The location selected for closure is in, in Oakland, California, off Hegenberger Road and I-880 between Oakland Airport and Oakland Coliseum. The two nearest In-N-Out Burger locations that would pick up the customers from the closed store are in Alameda and San Leandro. Below is a map that shows the before and after trade areas of these stores. The areas were created using as-the-crow-flies, straight-line distance, Thiessen Polygons. The San Leandro location would pick up the potential sales south of Hegenberger Road, with the Alameda site grabbing the customers to the north.
For more accurate territory boundaries, you could also use the Maptitude tools for the Huff Model and drive-time influence areas.
Courtesy of Brett Lucas

An analysis by AGS using
#Maptitude
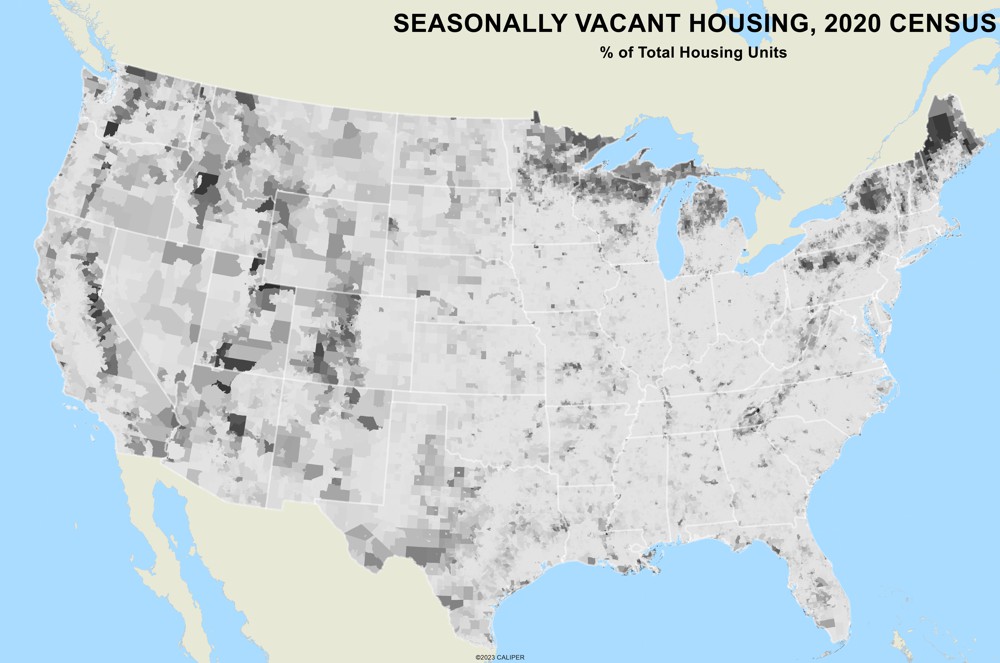
This article dives into the debate surrounding vacation rentals and their impact on the housing market. It analyzes data on seasonally vacant homes across the United States, revealing surprising results.
Key Findings:
Maptitude mapping software provides valuable tools for analyzing complex data like the distribution of seasonally vacant homes. By creating maps and visualizations, users can:
Courtesy of AGS
#Maptitude #VacationRentals #HousingMarket #DataAnalysis Applied Geographic Solutions, Inc.
An analysis by Brett
Lucas using #Maptitude
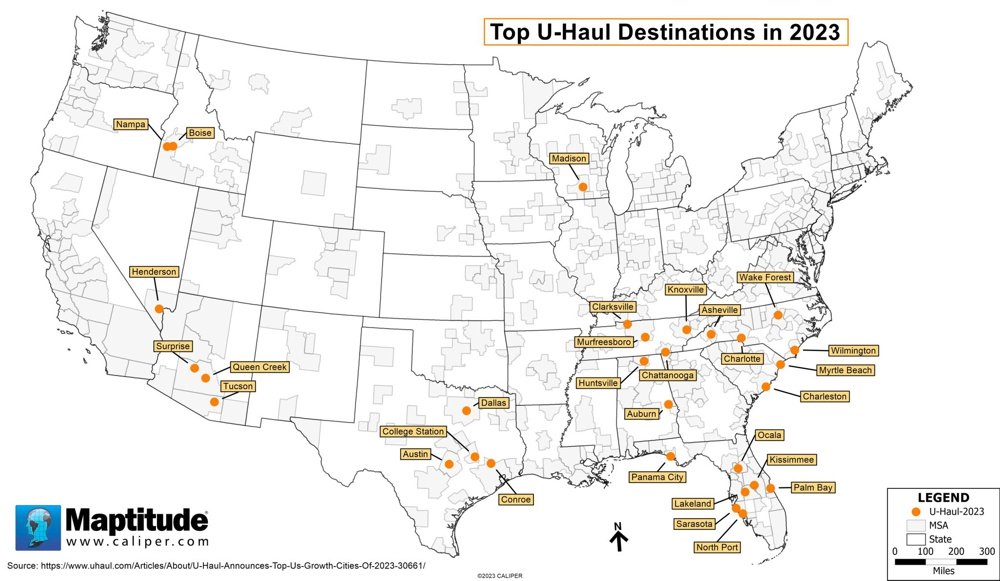
On January 3, 2024, U-Haul released their list of the top 30 “growth” cities for moves based on one-way truck rental data. A map showing these U-Haul locations displays an interesting distribution, with most of the places situated in southern US states. For further discussion of this map and data distribution jump to this video @11:55, where John Miglautsch discusses how just a few states have most of the growing towns.
Such growth has broad implications as highlighted, for example, in “What the South’s population boom means for 2030 redistricting”. Maptitude for Redistricting is used by a majority of the state legislatures, both political parties, county and regional governments, city and local governments, educational institutions, and many public interest groups and corporations.
Courtesy of Brett Lucas
#Maptitude #GIS #realestate #redistricting

An analysis by Murtaza
Haider using #Maptitude
The article discusses the cost of living in Toronto's suburbs, highlighting an interesting trend: inner suburbs are more affordable than their outer counterparts.
Here are the key points:
The maps use the heat color theme palette in Maptitude for Canada. In such a visualization, lower values are colder and bluer, whereas higher values are hotter and redder.
The article sheds light on the housing dynamics in Toronto, emphasizing the role of location, maps, and affordability in shaping residents' choices. Understanding these factors can help individuals make informed decisions when considering where to live in the city.
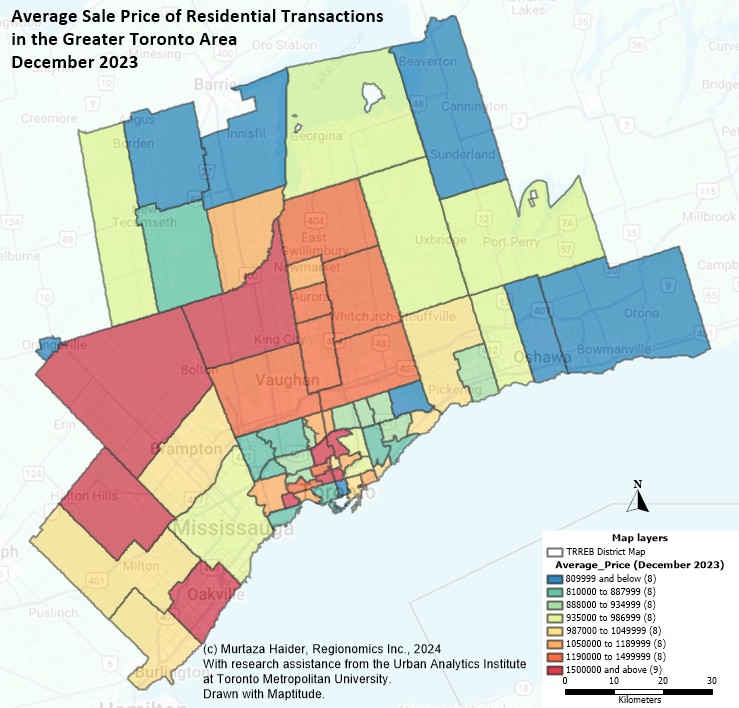
Housing prices in zones at the urban periphery of the City of Toronto are lower than in the neighboring outlying suburbs. Courtesy of Murtaza Haider.
An analysis by Brett
Lucas using #Maptitude
The community of Stoughton, Wisconsin, has a population of 13,173, is located to the southeast of Madison, and has four Kwik Trip locations. Using parcel data, one can "guesstimate" which households will go to a particular Kwik Trip based on geographic proximity using the Huff Model. We assume that gas prices are the same at all four locations, and that each location has the same grades of gas/diesel, and other food/snack/coffee offerings.
The trade areas of each site (areas in green in the map below) are delineated with a polygon area. Using Maptitude mapping software, these areas are overlayed with demographic and socioeconomic data such as population, median age, or household income, etc.. This locational data allows marketers to better tailor promotions to select geographies and populations.
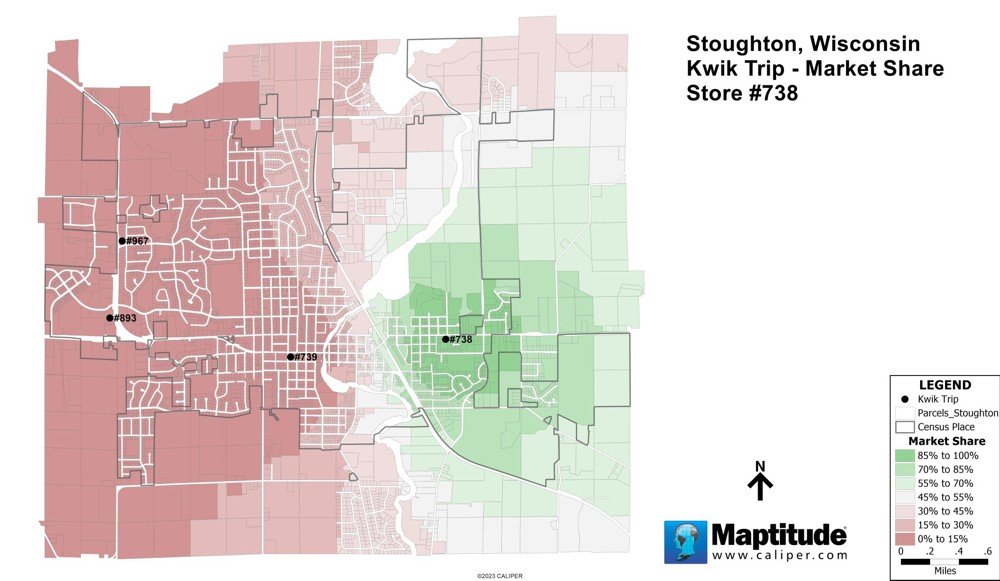
Courtesy of Brett Lucas.
#GIS #maptitude #locationanalytics #kwiktrip #geography
An analysis by Brett
Lucas using #Maptitude
A recent data release from the Bureau of Economic Analysis tabulates the change in GDP (gross domestic product) by county for each year, between the years of 2019 and 2022.
The Maptitude map below bridges the Covid-19 pandemic gap in 2020-2021, by looking at the change in GDP by county between the years 2019 and 2022. GDP is a critical economic measure and having this data at the county level is valuable for exploring economic trends and changes. Maptitude includes the most current version of county-level GDP and unemployment data for free.
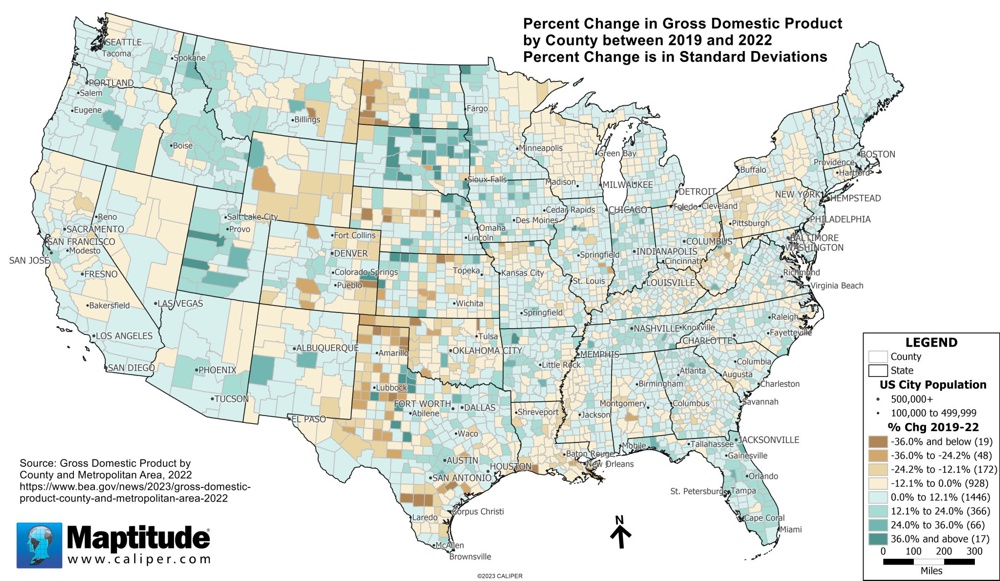
Map – Percent change in GDP from 2019-2022 in standard deviations above or below zero. Courtesy of Brett Lucas.
#GIS #Maptitude #GDP #economicdevelopment #economics #regionaldevelopment #geography
An analysis by Brett
Lucas using #Maptitude
Earlier this year, Dollar General opened a new Distribution Center (DC) in Blair, Nebraska (approximately 28 miles north of Omaha, NE), with access to US-75, US-30 and I-29. The new DC will handle both general merchandise and dry goods as well as perishables and food items. Once fully staffed, the new DC is planned to serve 1,000 store locations.
Using Maptitude GIS software and the “Build to Value” feature within the Buffers Tool (doing a store count), you can build an approximate trade area around the DC that grows until it encompasses 1,000 Dollar General stores (a Maptitude provided layer). Using Maptitude you can overlay the trade area shown in green with population or any other demographic or socioeconomic indicators.
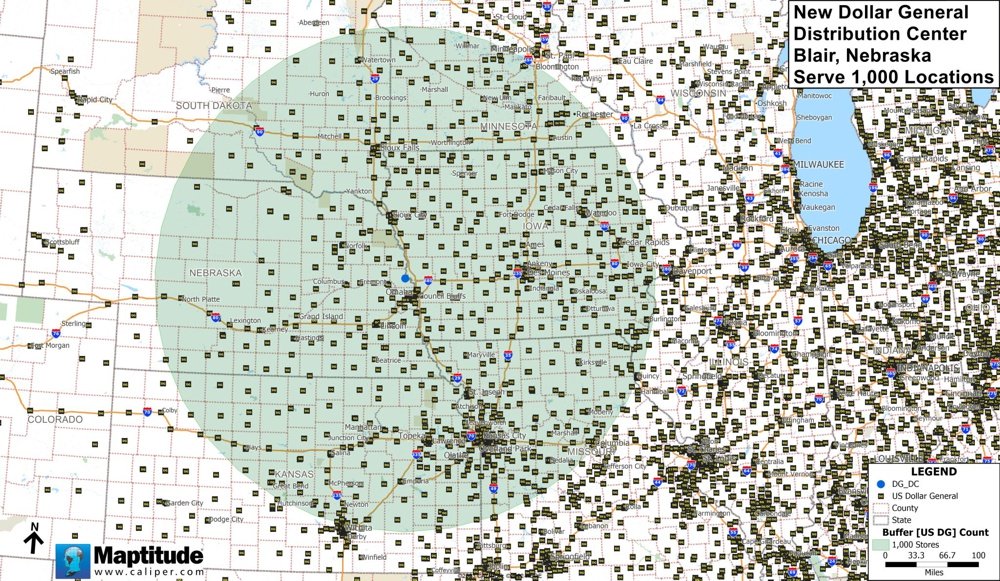
Courtesy of Brett Lucas.
#Maptitude #GIS #DollarGeneral #DistributionCenter #Tradearea
Learn more about Maptitude to see how you and your team can benefit from map-driven insights!
Schedule a Free Personalized Demo