Last Updated: September 7, 2023
You can perform a site location analysis using logistics mapping software.
Summary
Amazon performed a competitive site selection process and was considering metro regions in North America for its second corporate headquarters.
- Amazon HQ2 was projected to generate $5 billion in construction and create 50,000 jobs
- Amazon wanted one competitive response per metropolitan statistical area (MSA)
- A similar layout to Amazon’s Seattle campus was preferred
The Maptitude mapping software is an excellent tool for data analysis and visualization. We will use several different Maptitude tools to explore how they work together to provide tangible results. As an exercise we will:
- Explore the characteristics of a study area in the USA
- Work through a real-world set of requirements
Amazon HQ2 Building/Site Requirements
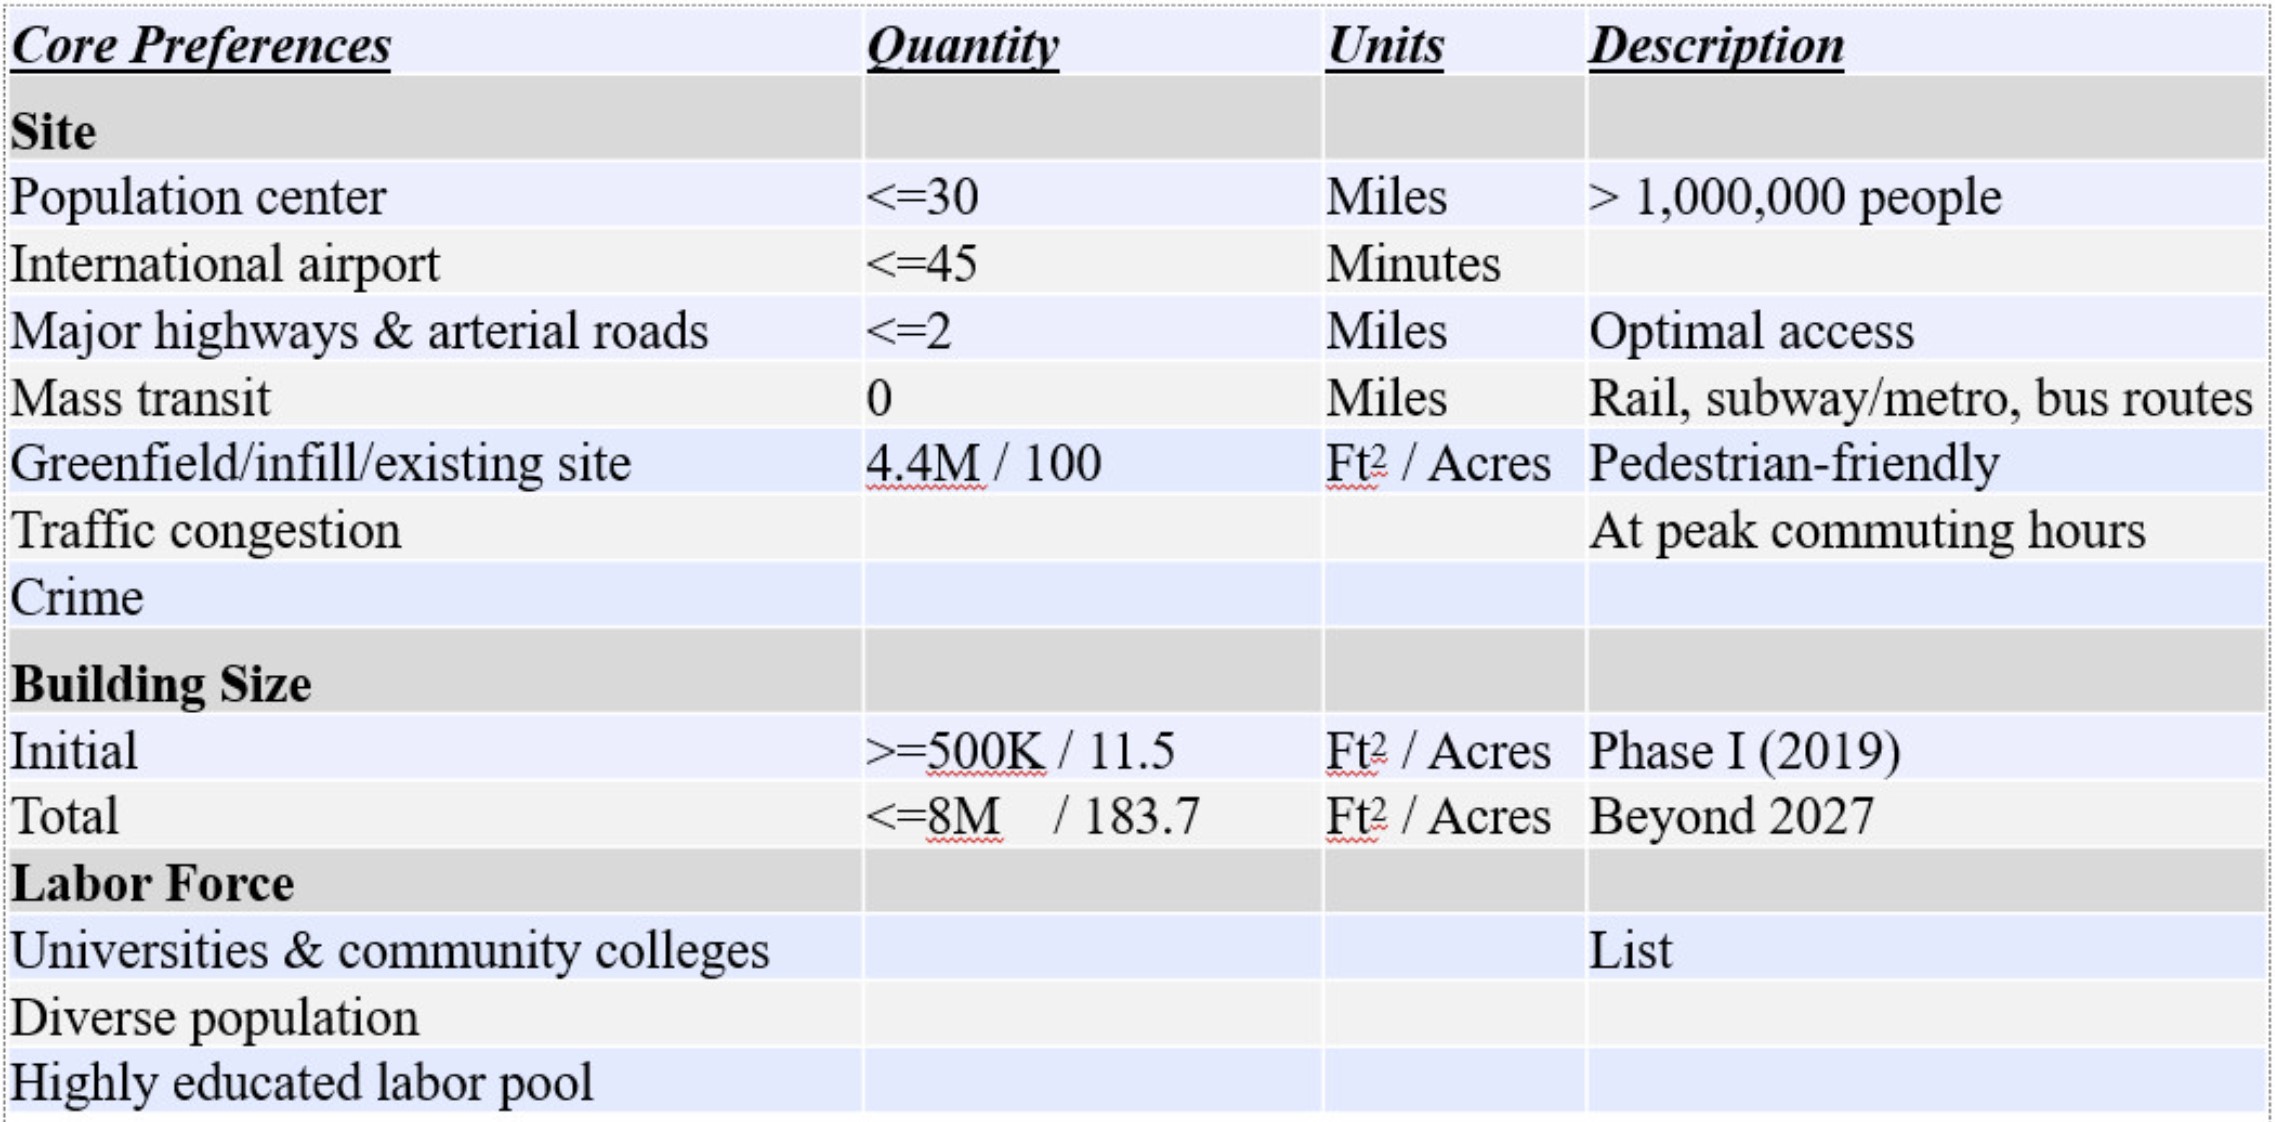
Population Center
First, we will filter the metro areas that meet the population and educational requirements, by having at least:
- A population of 1 million
- 32% of adults with at least a bachelors degree
- 3% of the workforce in the Information sector (NAICS 51)
- 14% of the workforce in the Professional, Scientific, Technical and Business Management sectors (NAICS 54-56)
The existing Seattle HQ meets these criteria, so we’re headed in the right direction. To filter for these metro areas, do the following:
- Open a new map of the United States and make MSA the working layer.
- Go to Selection>Select by Condition and enter the following condition:Population >= 1000000
& [25+_% bachelor’s degree or higher] >= 32
& ([EC 16+_Ind: Information] / [Employed civilian population 16+]) >= 0.02
& ([EC 16+_Ind: Prof/scientific/admin] / [Employed civilian population 16+]) >= 0.14 - Right-click on MSA and choose “Hide Unselected Records” to show just the selected records.
City Shortlist
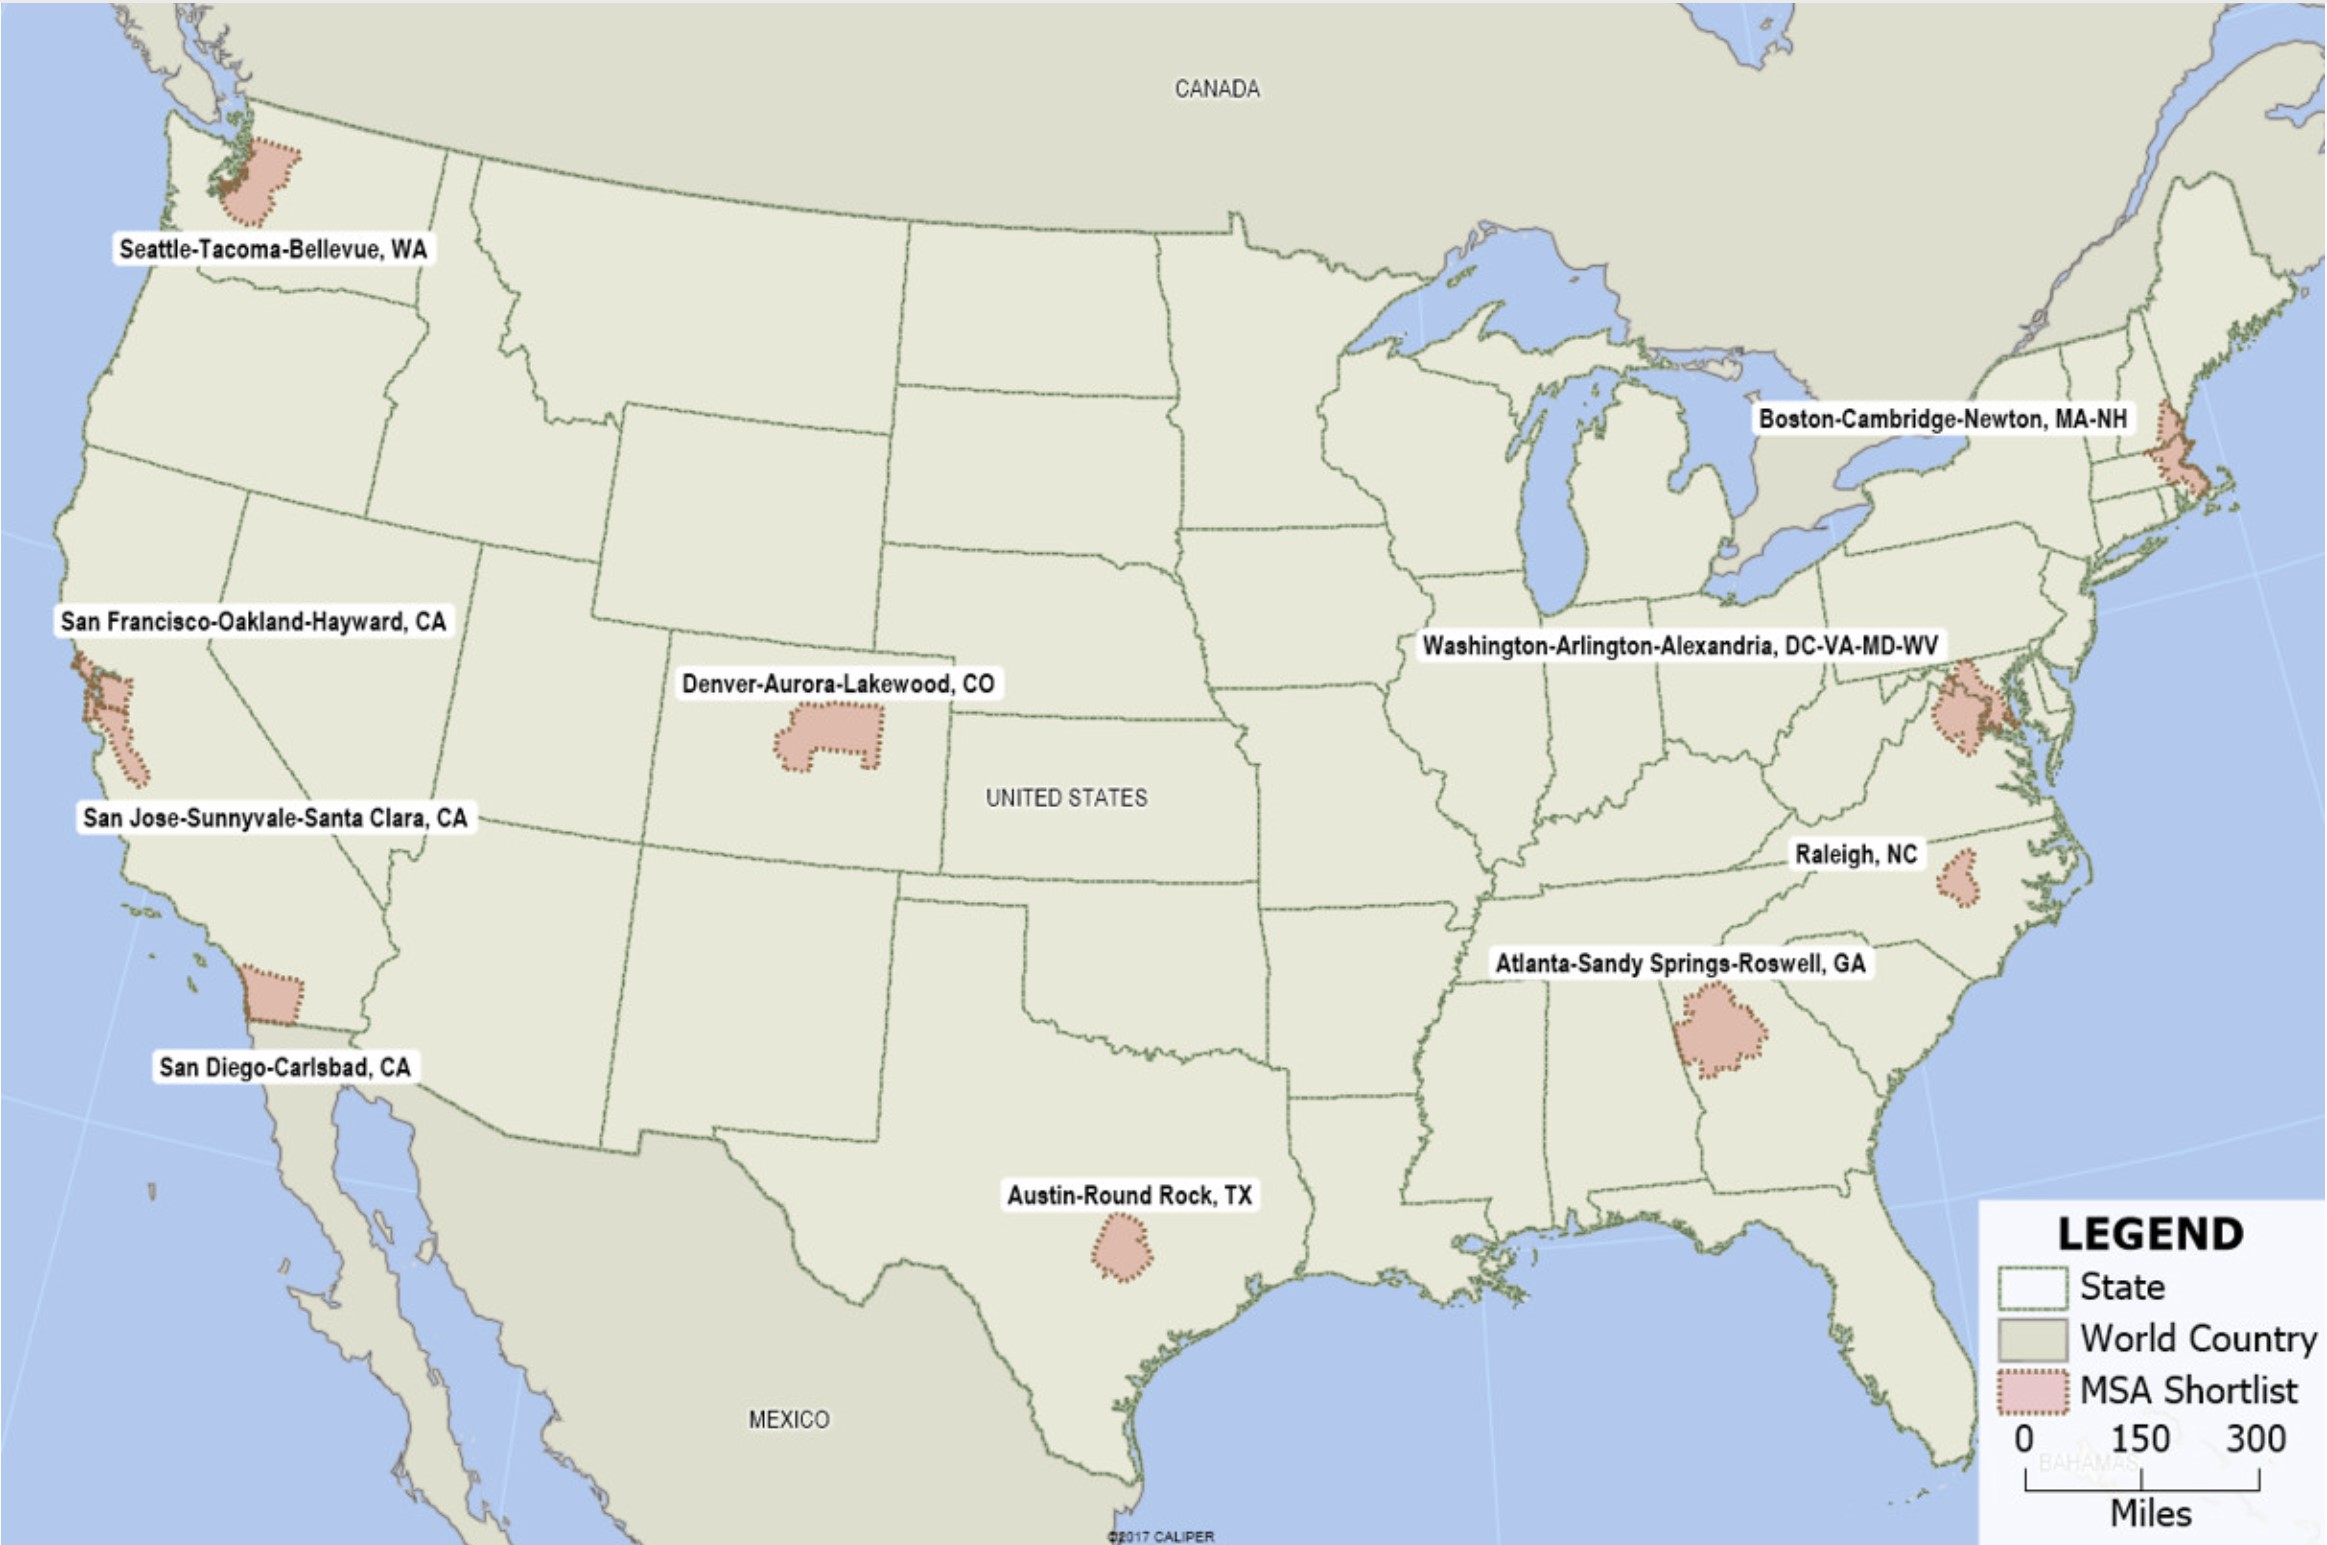
These cities meet the above criteria.
- Atlanta-Sandy Springs-Roswell, GA
- Austin-Round Rock, TX
- Boston-Cambridge-Newton, MA-NH
- Denver-Aurora-Lakewood, CO
- Raleigh, NC
- San Diego-Carlsbad, CA
- San Francisco-Oakland-Hayward, CA
- San Jose-Sunnyvale-Santa Clara, CA
- Seattle-Tacoma-Bellevue, WA
- Washington-Arlington-Alexandria, DC-VA-MD-WV
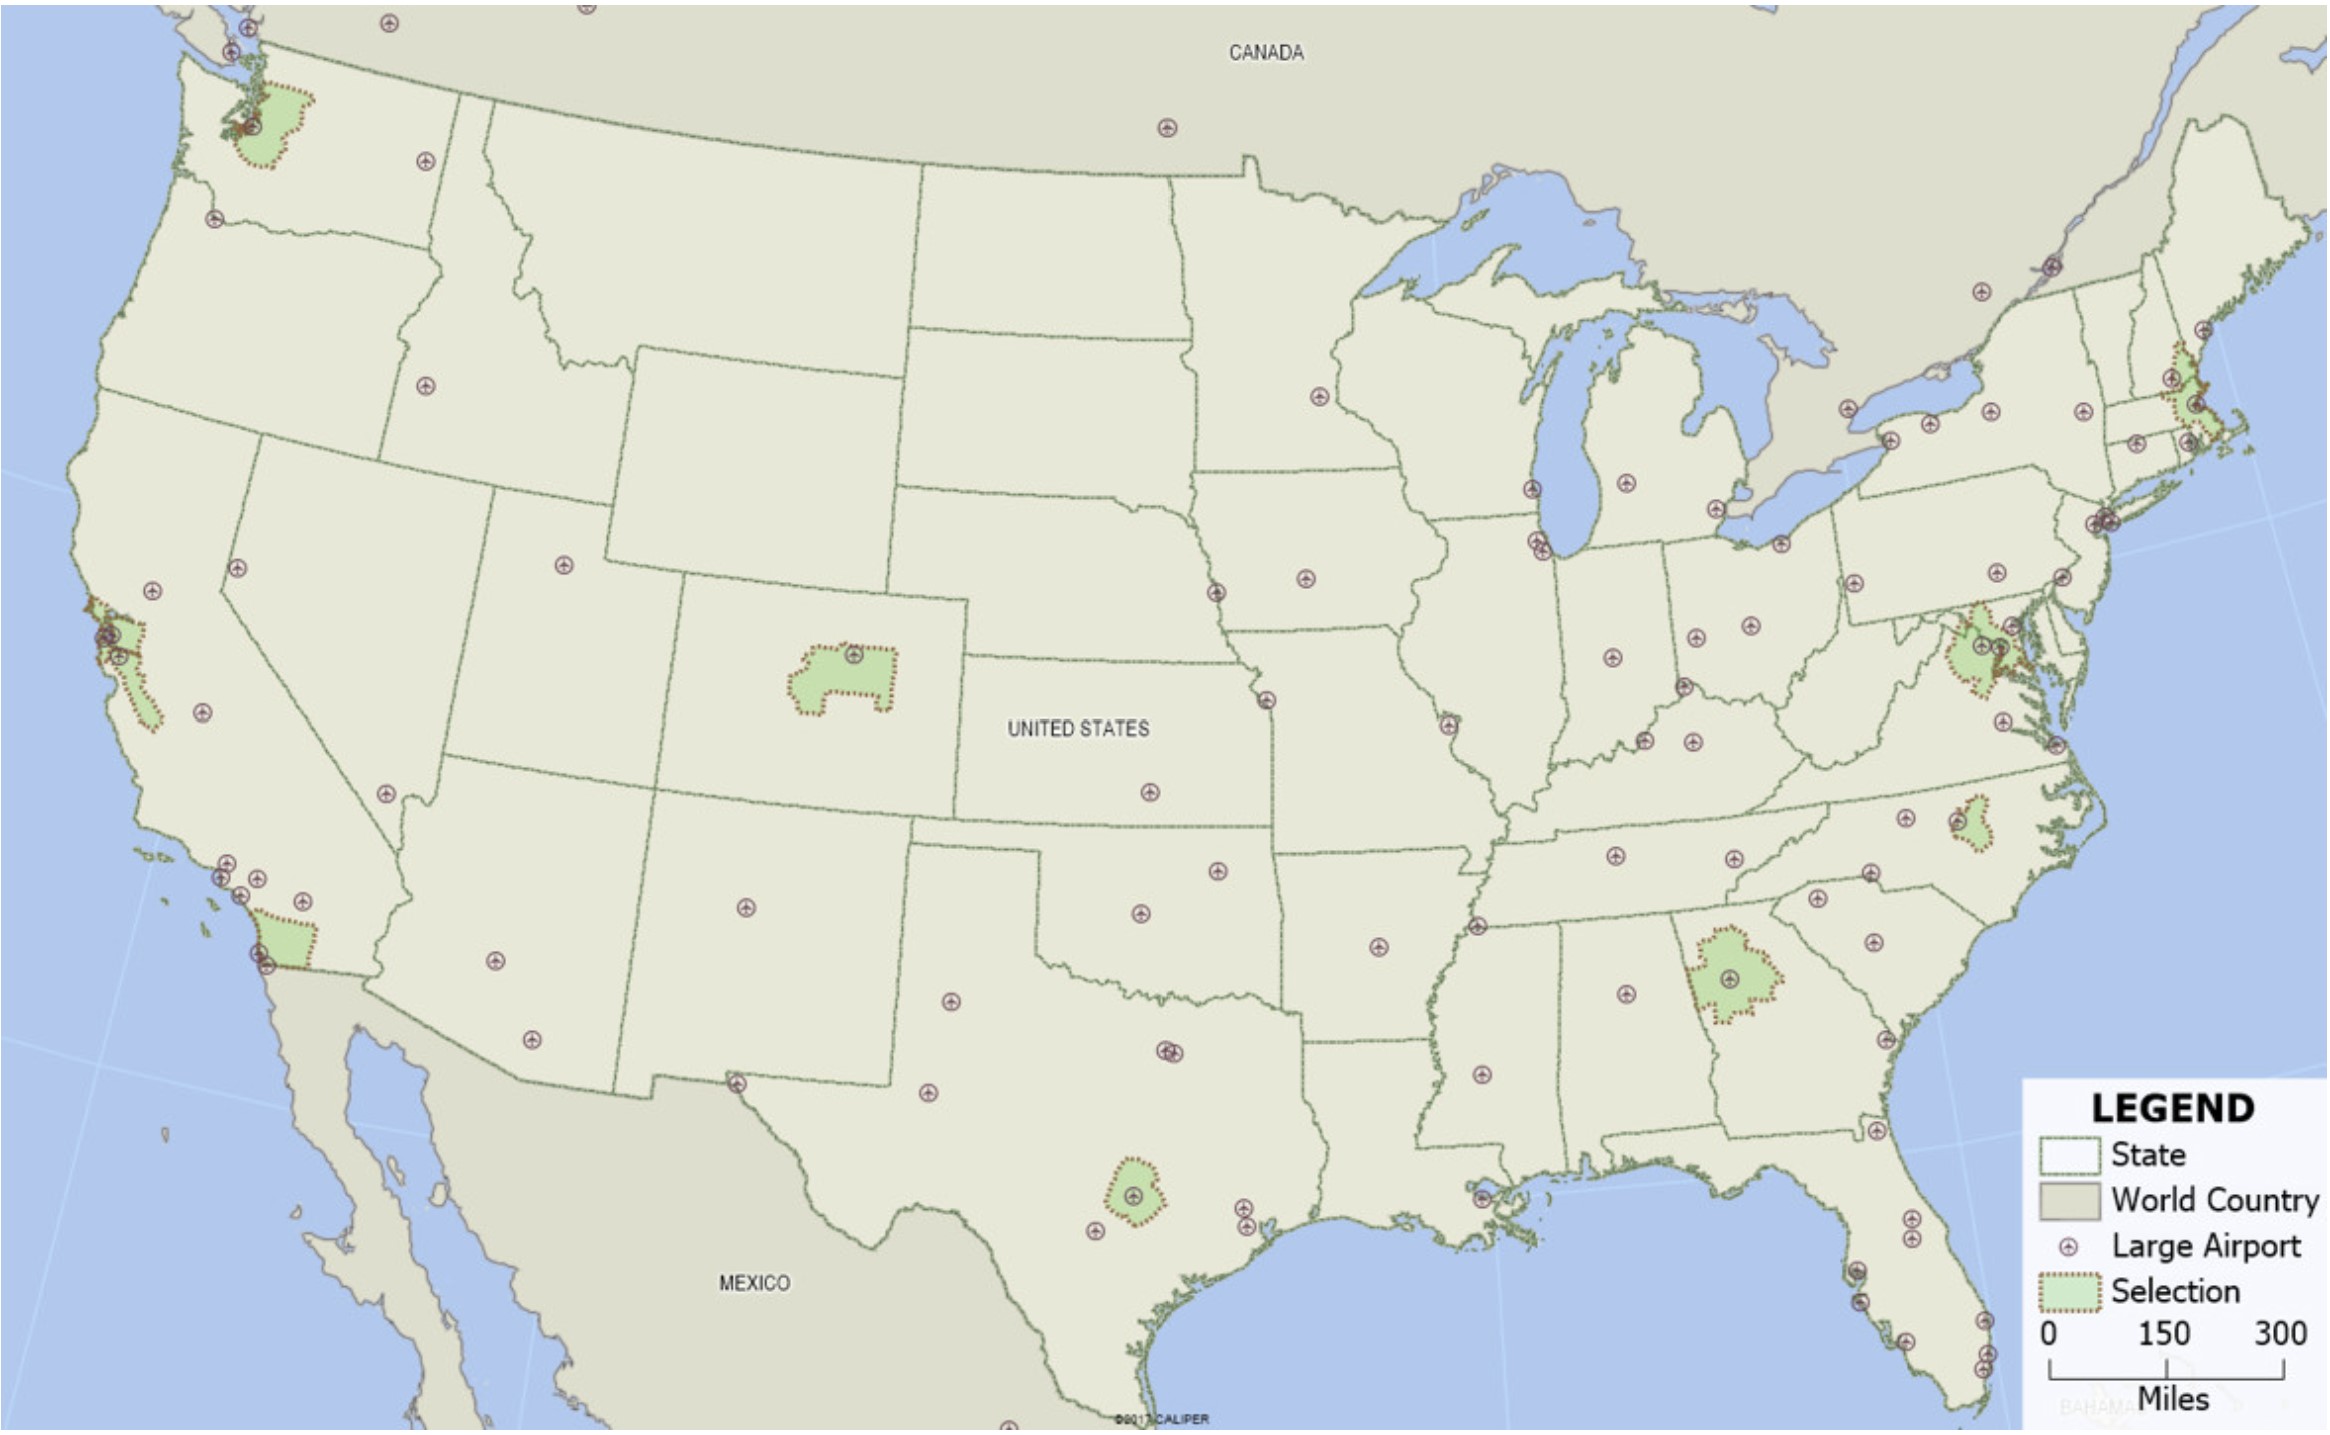
To add major airports to this map, go to Map>Layers, click “Add Layer” and navigate to ‘C:\ccdata\USA (HERE) – 2020 Quarter 4\ccNorthAmericanAirport.Cdf’.
Each of the MSAs contains a major airport as required by the RFP.
MSA: Boston
We will now focus on the Boston MSA to see how it meets the Amazon criteria.
First, zoom to Boston by going to Edit>Find and entering “Boston, MA”. Then create a freehand 30-mile ring and a 45-minute drive-time ring around Boston and export them to Excel. We want to make sure that our location encompasses the following:
- Extensive higher education
- Diverse population
- A major airport
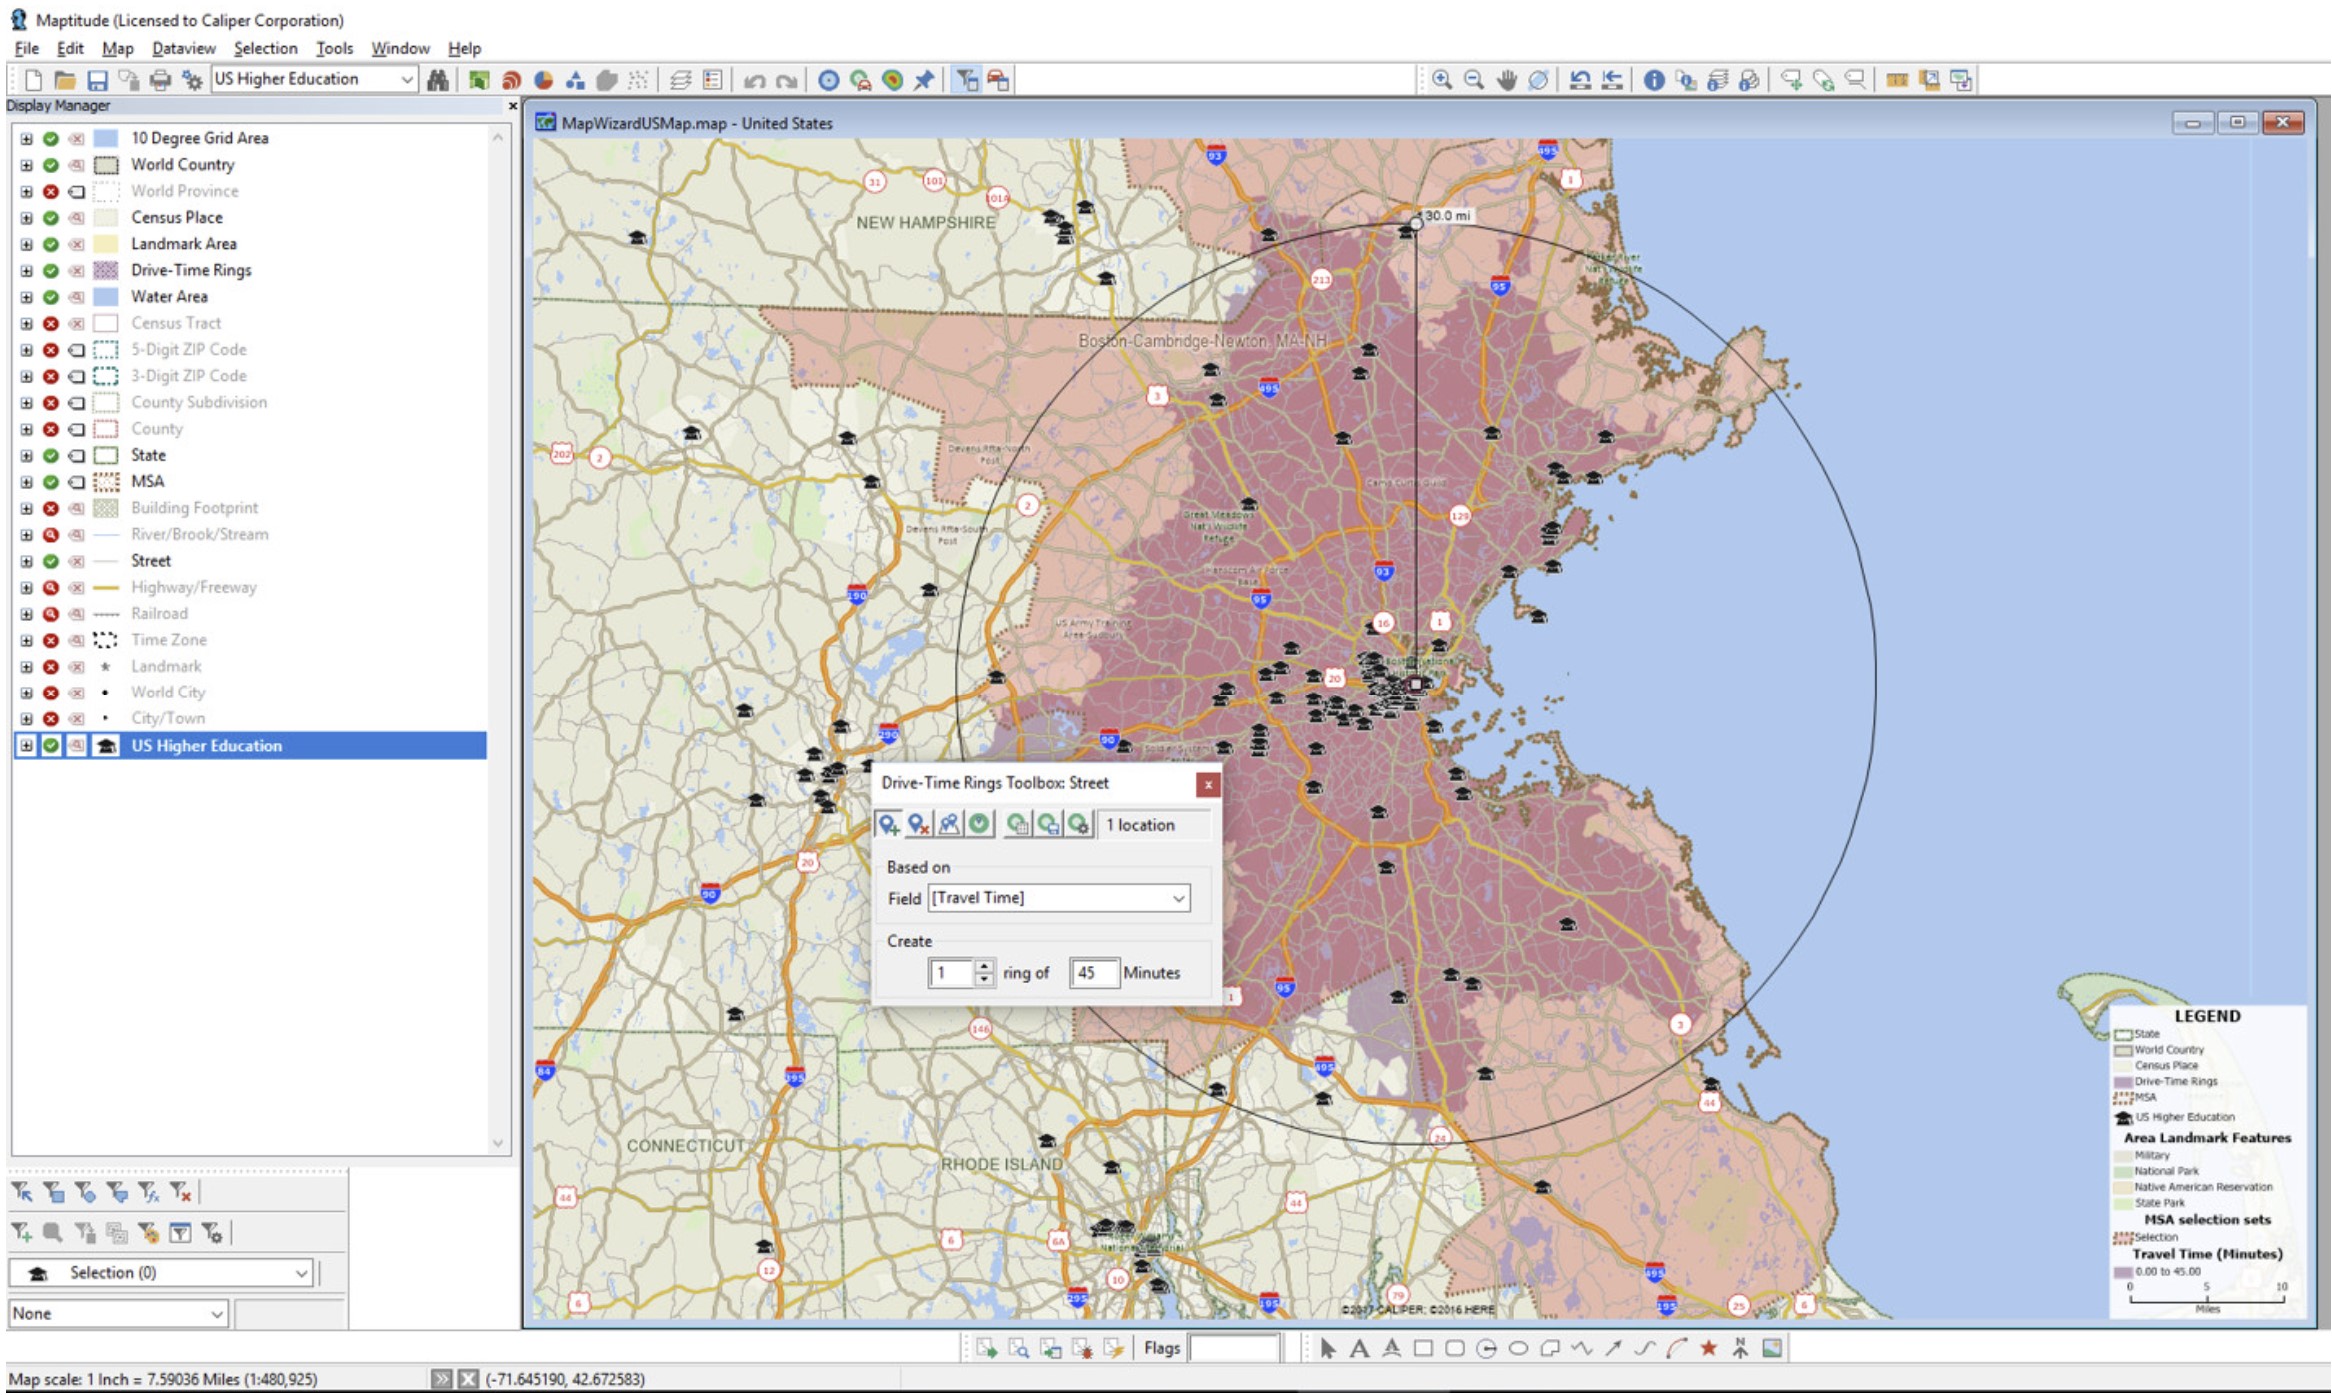
Our demographic exports of those rings will show the higher education institutions, airports, and racial/ethnic/gender diversity of the region.
Building/Site
The above analysis is possible with Maptitude mapping software out-of-the-box.
Next, we will geocode our address list of potential site locations and analyze their suitability using the following criteria:
- Geocode brownfields
- Filter by size and location
- Proximity to: Highways & mass transit
Brownfields
We obtained and geocoded a list of brownfield sites in Maptitude.
- Source: Massachusetts Department of Environmental Protection
- These properties are typically abandoned or for sale or lease and have been used for commercial or industrial purposes and may be contaminated
In this exercise, we will not be looking at greenfield sites. Greenfield properties are previously undeveloped sites for commercial development or exploitation.
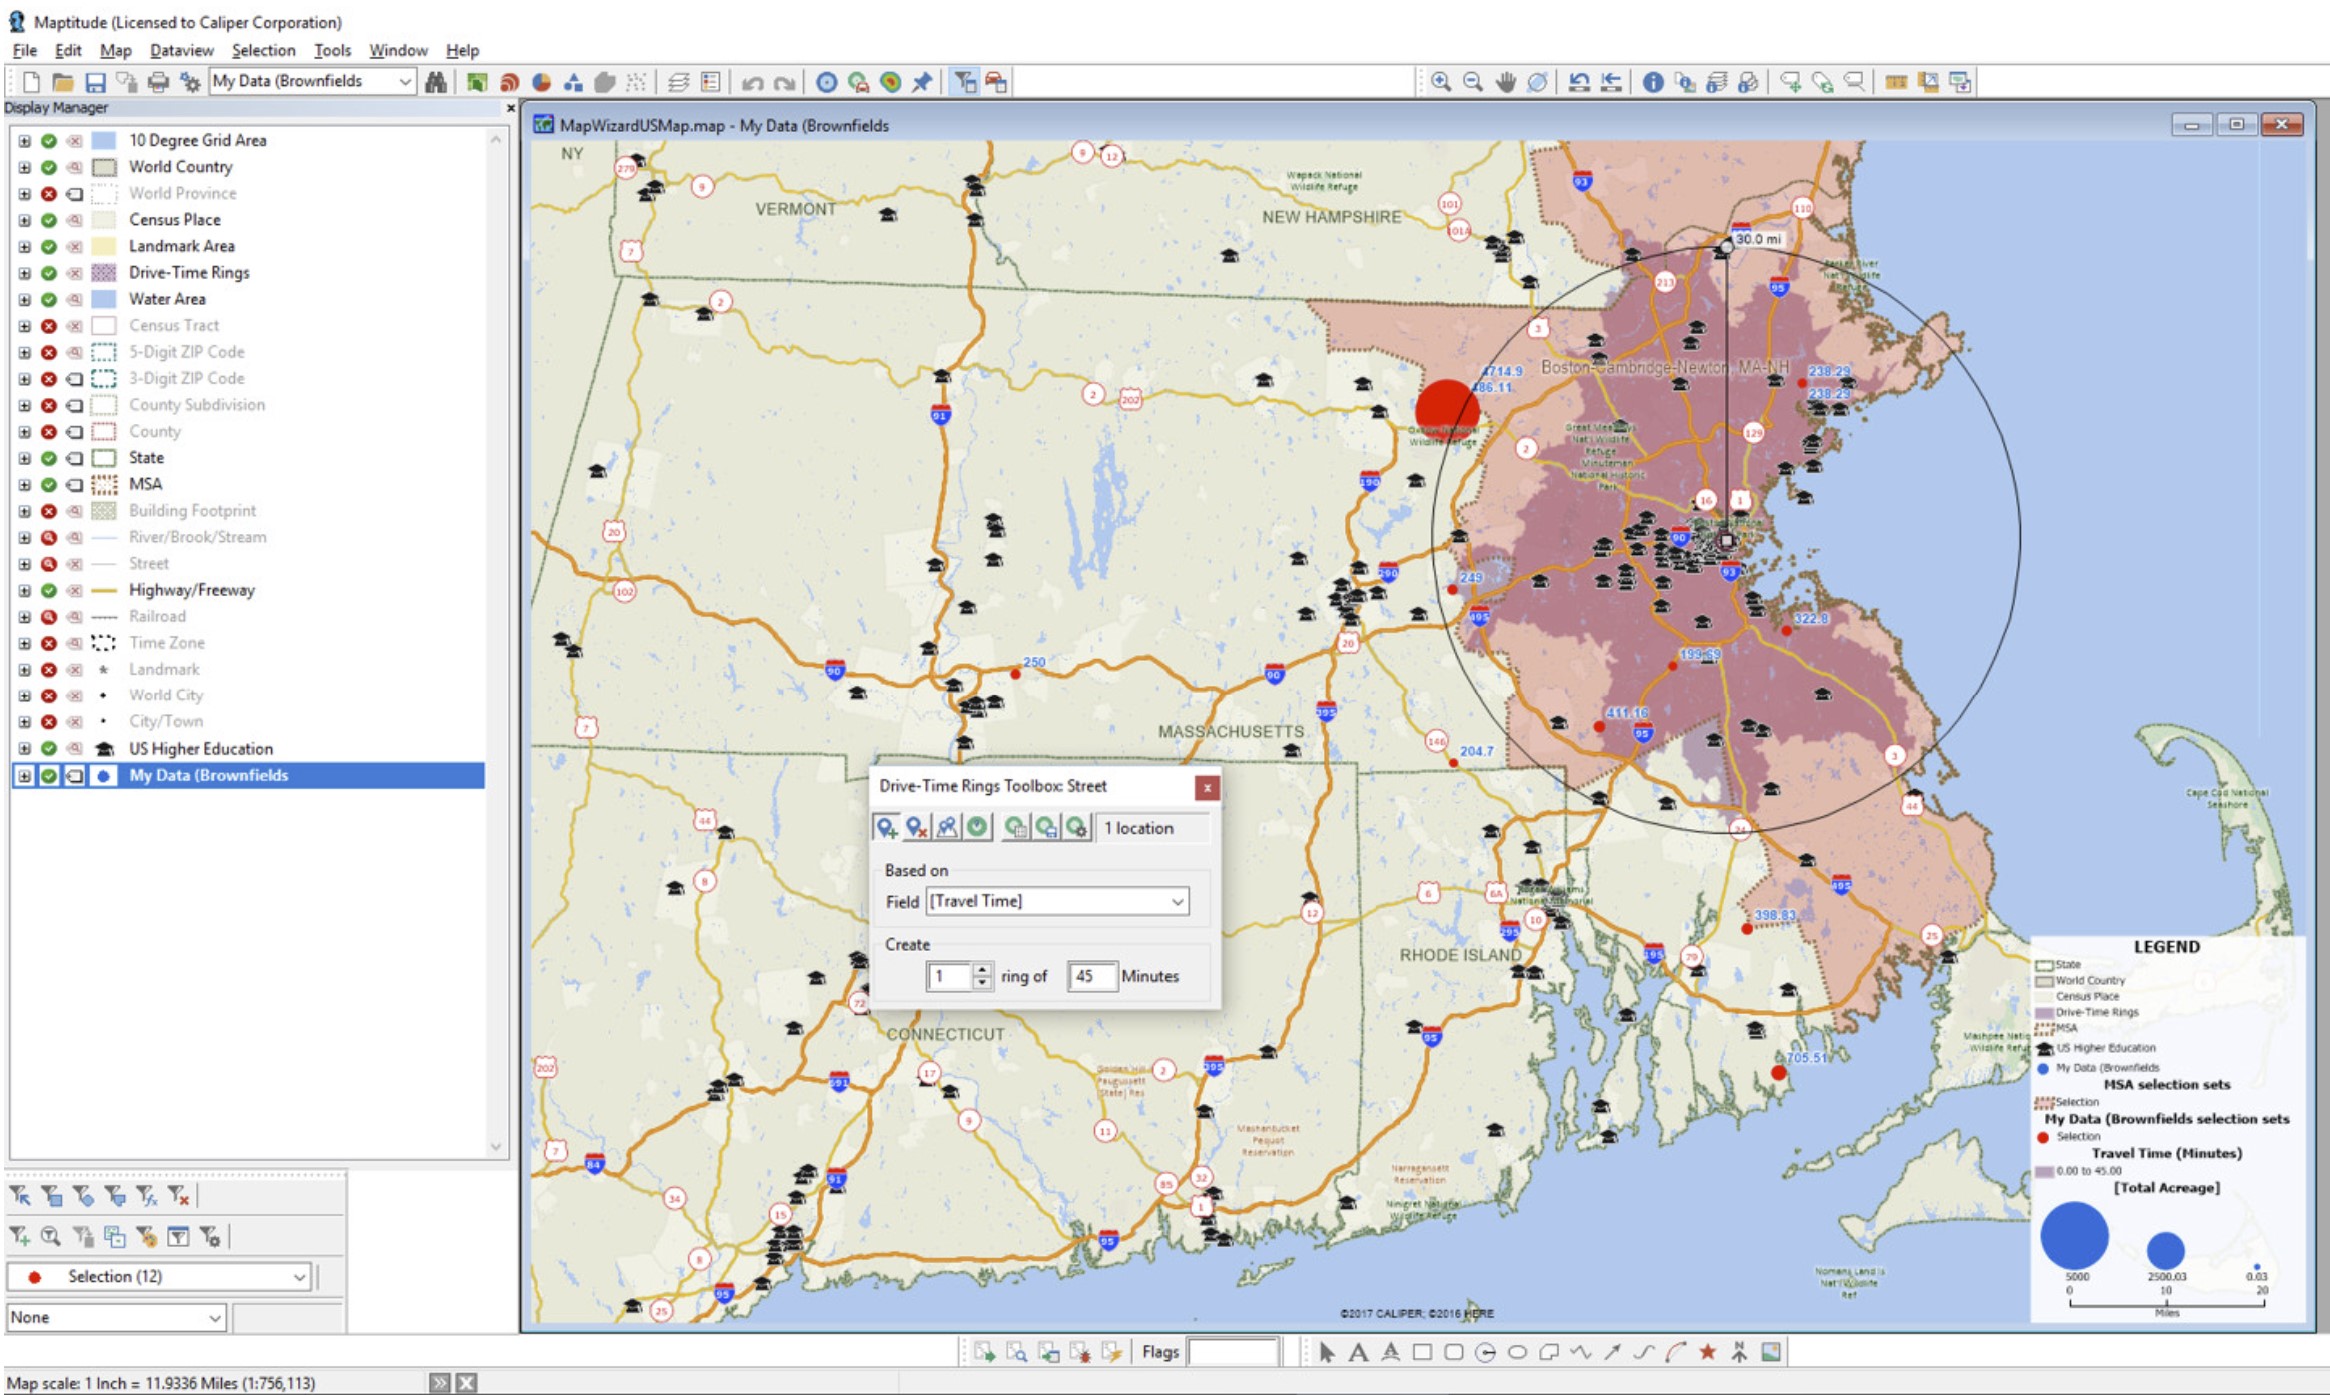
Similar to our initial MSA search, we will filter our brownfield sites for our given criteria. To filter by size/acreage, do the following:
- Geocode your brownfield locations and make them the working layer.
- (optional) Add a size theme to your points based on [Total Acreage].
- Go to Selection>Select by Condition and enter the following condition:
[Total Acreage] >= 184 - Right-click on your Brownfield site layer and choose “Hide Unselected Records” to show just the selected sites.
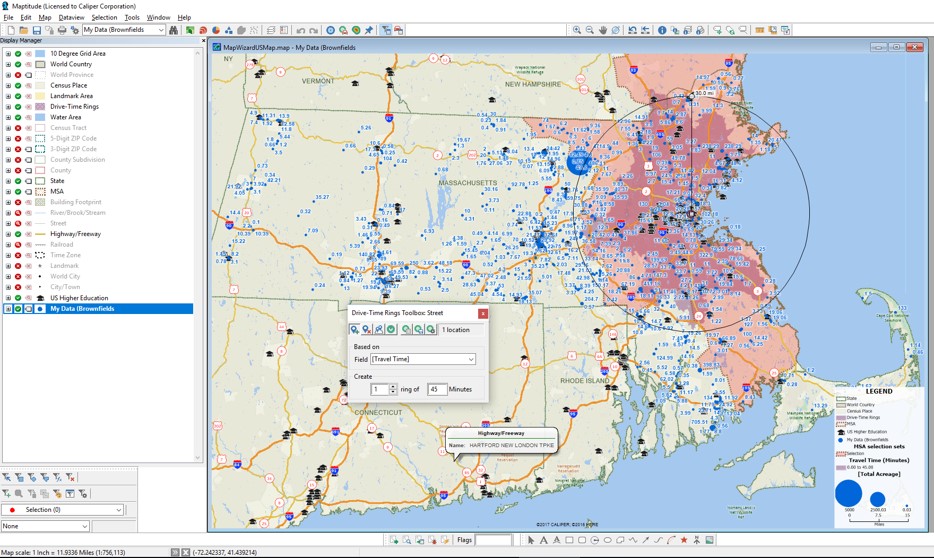
To further filter by proximity to mass transit, do the following:
- Choose Tools>Analysis>Buffers and enter 1.4 for the Size.
- Check Separate Buffers and for Buffer Names From choose “Site Name”.
- Check Calculate Demographics and then click
 .
. - For Overlay with Layer choose None, click
 to choose the mass transit locations and click Clear.
 - For Filter type “Commuter Rail Station”, highlight Commuter Rail Station, click Add>>, then click OK three times to save the file.
Proposed Site
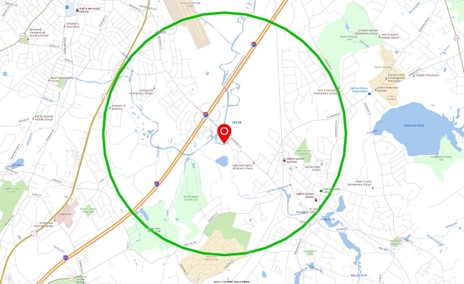
The former Canton Airport site has the most commuter rail stations in the closest proximity. This site is also adjacent to a major interstate intersection and many amenities.
Conclusion
Mapping software has progressed to the point that wizard-driven tools, embedded data, and intuitive interfaces mean that even novice users can tackle and explore complex tasks. We call this “Mapping without Tears”™. We were able to quickly explore the criteria laid out by Amazon with the US$695 Maptitude software.
The former Canton airport site may have been converted into a park, but is listed as a brownfield site by the MA DEP. Maybe losing a park for an Amazon HQ would be an acceptable trade-off for residents!
UPDATE January 18th, 2018:
Toronto was the only non-US city to make it to the 20 city shortlist. The others are Atlanta, Georgia; Austin, Texas; Boston, Massachusetts; Chicago, Illinois; Columbus, Ohio; Dallas, Texas; Denver, Colorado; Indianapolis, Indiana; Los Angeles, California; Miami, Florida; Montgomery County, Maryland; Nashville, Tennessee; Newark, New Jersey; New York City; Northern Virginia; Philadelphia, Pennsylvania; Pittsburgh, Pennsylvania; Raleigh, North Carolina; and Washington DC.
UPDATE February 14th, 2019:
Amazon selected Arlington for their HQ2 site, as well as Queens, New York.
For more information on selection sets, please see the Maptitude tutorial video on selection sets.
For more information on the freehand radius, please see the Maptitude tutorial video on drawing items.
For more information on drive-time rings, please see the Maptitude tutorial video on drive-time rings.
