Last Updated: August 6, 2024
You can use business mapping software to identify the best intersection for your new site location.
In this article, you will define your scope by zooming in to your area of interest, select the intersections of interest, calculate demographics for each intersection in that area, and visualize intersection scores.
Step 1: Prepare a map
- Zoom to the area of interest using the Zoom In and Zoom Out buttons in the Zoom Toolbar or go to Edit>Find to search for a specific address, ZIP Code, or City.
Step 2: Select relevant streets
- Make the Street layer the working layer.
- Go to Selection>Select by Condition.
- We want to exclude minor roads, unpaved roads, other vehicle roads, walking trails, and ferry routes, so enter the condition:
(ccStyle <> 30) and (ccStyle <> 40) and (ccStyle <> 41) and (ccStyle <> 50) and (ccStyle <> 55) - In the Set Name drop down, type in Busy Roads.
- Check the Select from visible features only checkbox and click OK.
Step 3: Select intersections connected to the relevant streets
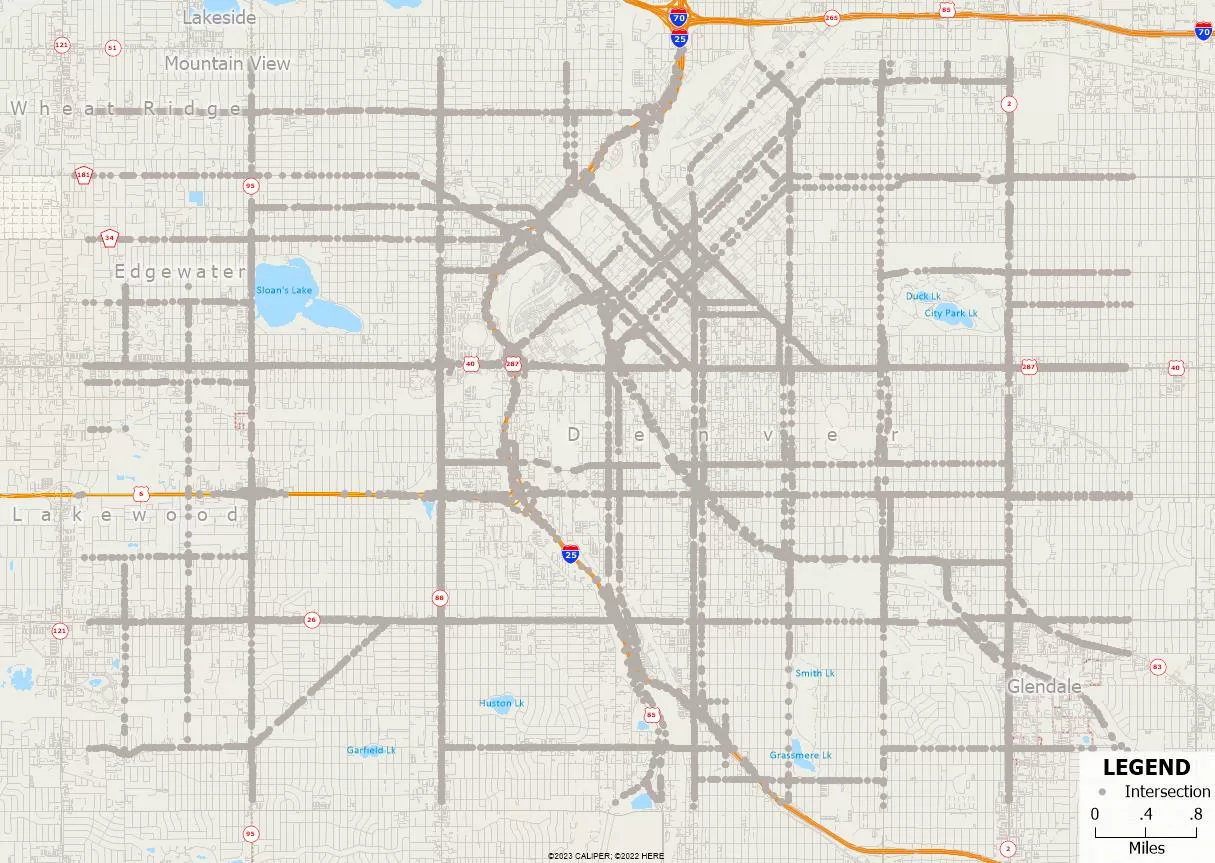
- You will need to use the Intersection layer that is hidden by default in Maptitude maps so go to Map>Layers, choose the Intersection layer from the scroll list, click Show Layer, and click Close. The Intersection layer will be added to the map and will be the working layer.
- Go to Selection>Select by Location, choose to select intersections based on features in the Street layer and in the Busy Roads selection set.
- Choose Connected from the third drop-down list, name the selection set Busy Intersections by typing in the editable Set Name drop-down list, and click OK.
- We want to exclude intersections with only two connected streets, so go to Selection>Select by Condition and enter the condition:
ArrayLength(GetNodeLinks(ID)) > 2 - Choose Busy Intersections from the Set Name drop-down list, choose Subset from the Selection Method drop-down list, and click OK.
- It is not necessary to highlight the selected intersections, so go to Selection>Settings, highlight the Busy Intersections set in the scroll list, click Status to make it inactive, and click Close.
(Optional) Use GISDK to select intersections of relevant streets
To further refine your selection of intersections from above, you can try the steps here to identify major thoroughfare intersections and reduce possible locations.
- Go to Tools>GIS Developer’s Kit>GISDK Toolbar.
- Click the Immediate Execution button.
- Copy and paste the following:
- Click Run.
- Proceed with the rest of the steps.
SetLayer("Intersection")

arrNodeIDs = GetSetIDs("Intersection"+"|Busy Intersections")

v = a2v(arrNodeIDs)

for i = 1 to arrNodeIDs.length do

  links = GetNodeLinks(arrNodeIDs[i])

  SetLayer("Street")

  x = IsMember("Busy Roads", id2rh(a2v(links)))

  SetLayer("Intersection")

  y = if x = "True" then 1 else 0

  v[i] = y.sum()

end

vNodeIDs = a2v(arrNodeIDs)

vNodeIDs = if v > 2 then vNodeIDs else null

SelectByIDs("Busy Intersections", "Several", v2a(vNodeIDs))

Step 4: Calculate demographics for the selected intersections
- Go to Tools>Analysis>Overlay.
- Choose to use the Busy Intersections from the Overlay drop-down list.
- Specify a buffer size and units. For instance, a buffer size of 0.5 miles will calculate demographics within a 0.5-mile radius around each selected intersection.
- Uncheck both the Count the Number of Features and Create a Report boxes. Optionally, you can modify the demographic fields being calculated by clicking Attributes.
- Click OK to calculate demographics for the selected intersections. Note, this step may take awhile if you are looking at a fairly large area.
Step 5: Use a formula field to calculate scores
To determine the best intersections based on specific demographic criteria, you can assign scores using a formula field. For example, we want to score intersections based on the following criteria:
- Median household income is greater than $70,000
- Median household income growth of at least 10%
- Population is greater than 5,000
- Population growth is at least 10%
- At least 20% of housing is owner-occupied
Follow the steps below to create the scores:
- Go to Dataview>Formula Fields. Enter a formula based on your criteria. In this case enter:
(If [Estimated Median HH_Income] > 70000 then 1 else 0) + (If [Estimated % Change in Median HH_Income] > 0.10 then 1 else 0) + (If Population > 5000 then 1 else 0) + (If [% Change in Population] > 0.1 then 1 else 0) + (If [Owner occupied] / Households > 0.2 then 1 else 0)
- Name the formula field Score and click OK. This formula calculates a score based on the defined demographic criteria.
Step 6: Visualize the scores using a color theme
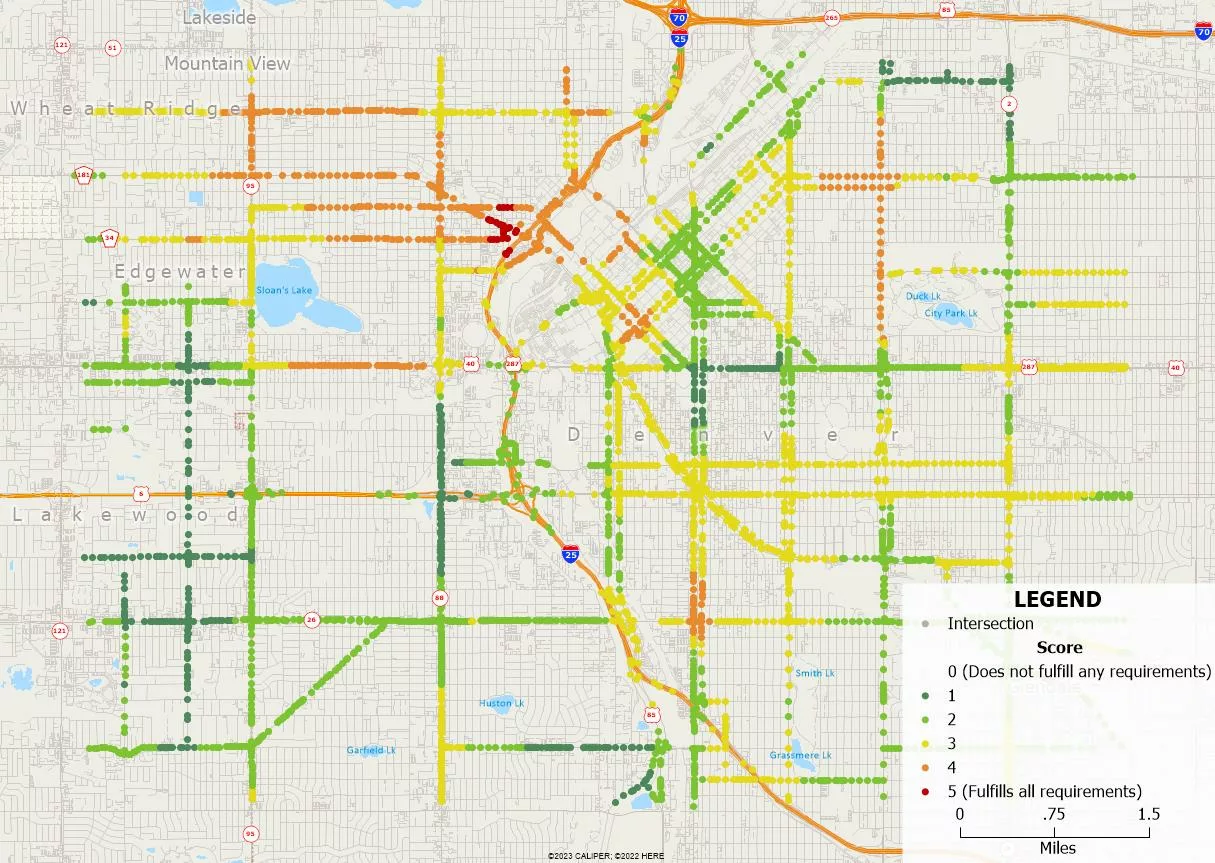
- Make the map the active window, make sure the Intersection layer is the working layer and go to Map>Thematic Mapping>Color.
- Choose Score from the Field drop-down list and choose List of Values from the Method drop-down list.
- On the Styles tab, customize the style for each score category as desired and click OK. This visualization will provide a clear understanding of the intersections that meet the specified demographic criteria.

Step 7: Clean up the map
You may want to make several cosmetic changes to the map. For example:
- You may want to have the intersections to display after the street layer or other features. Choose Map>Layers, highlight the Intersection layer, and click Move Down until it is after the Street layer, and click Close.
- You may want to clear the Busy Roads selection set on the street layer so that those streets are no longer highlighted. Expand the Street layer in the Display Manager, then expand Sets under the Street layer, and click the green check symbol next to the Busy Roads set to make it inactive.
To use your own data in a demographic analysis, please see the Maptitude demographic report tutorial.
Maptitude also has a facility location tool that can identify the best facility from a set of candidate facilities. For a tutorial on the facility location tool, please see the Maptitude facility location tutorial video.
For a real life example of a site analysis, please see the Amazon HQ2 location analysis conducted in Maptitude.
