Last Updated: April 22, 2024
To conduct market research, you can use market research mapping software.
Market research helps businesses make informed decisions about their products, marketing strategies, and target audience.
The data and geographic analysis tools included with Maptitude mapping software will help you conduct actionable and thorough market research.
To follow along with the steps in the article below, you can use your own license of Maptitude or request a free trial of Maptitude mapping software.
Table of Contents
Customer Segmentation Based on Location
Geographically Targeted Digital Advertising
Market Planning and Decision-Making
Customer Segmentation Based on Location
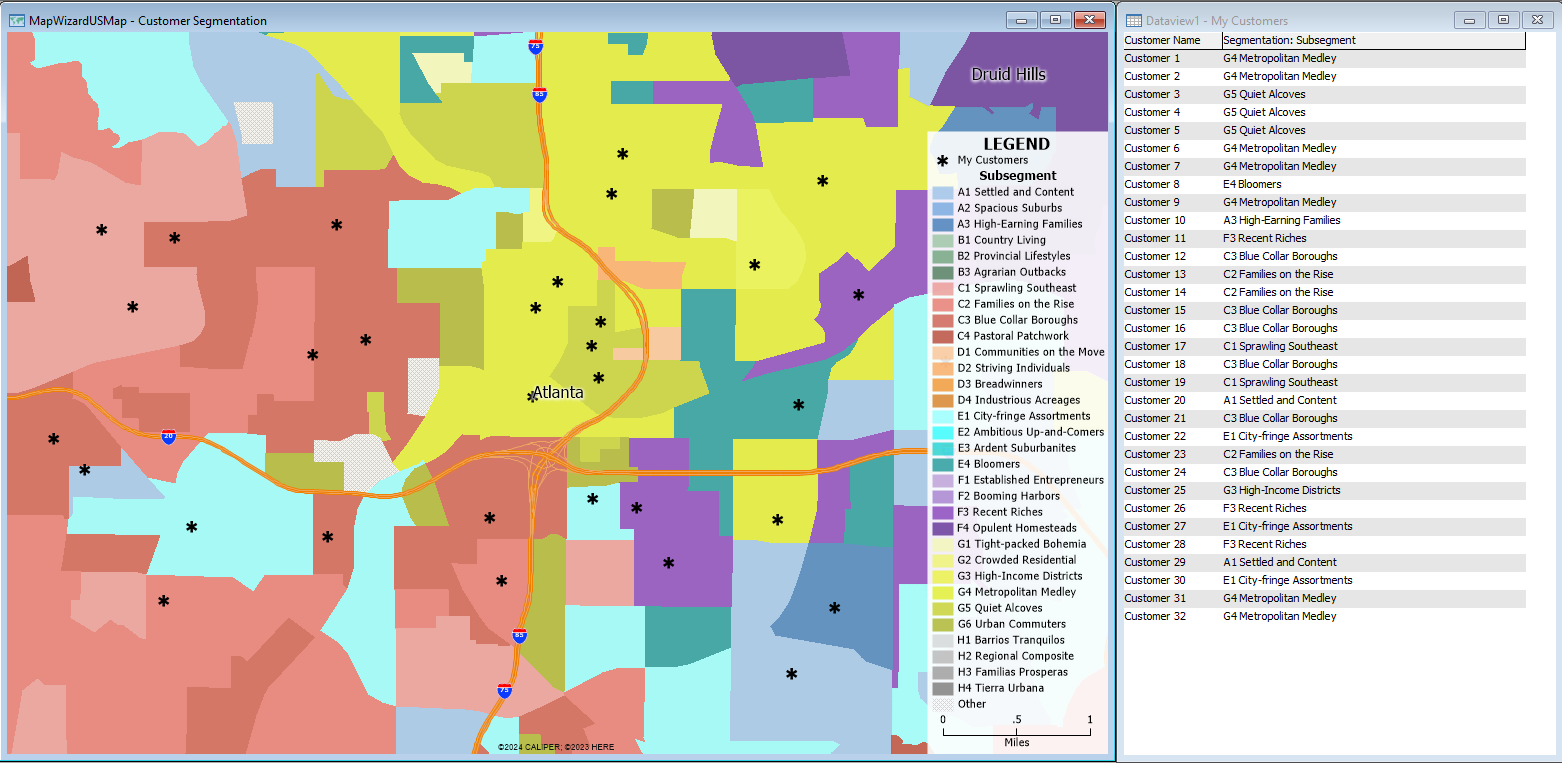
With Geodemographic Segmentation data available to Maptitude users, you can identify distinct customer clusters, tailor marketing strategies, and deliver personalized content to specific regions.
By identifying each customer’s demographic subsegment, you can gain valuable insights into your customer data.
You can find the demographic subsegment of your customers by following the steps below:
- Map your customer data by following the video tutorial on mapping your own data in Maptitude.
- Download and install the Geodemographic Segmentation free data add-on.
- Add the Geodemographic Segmentation layer by going to Map>Layers>Add Layer and choosing to open the file “C:\ccdata\Geodemographic Segmentation 20XX\ccGeodemographicSegmentation.cdf “.
- Make your customer layer the working layer.
- Go to Tools>Analysis>Tag Points by Area.
- Choose Segmentation for the Source Data Layer and choose to tag with the Subsegment field.
Maptitude will display the subsegments on the map and show the subsegment that each customer belongs to.

Geographically Targeted Digital Advertising
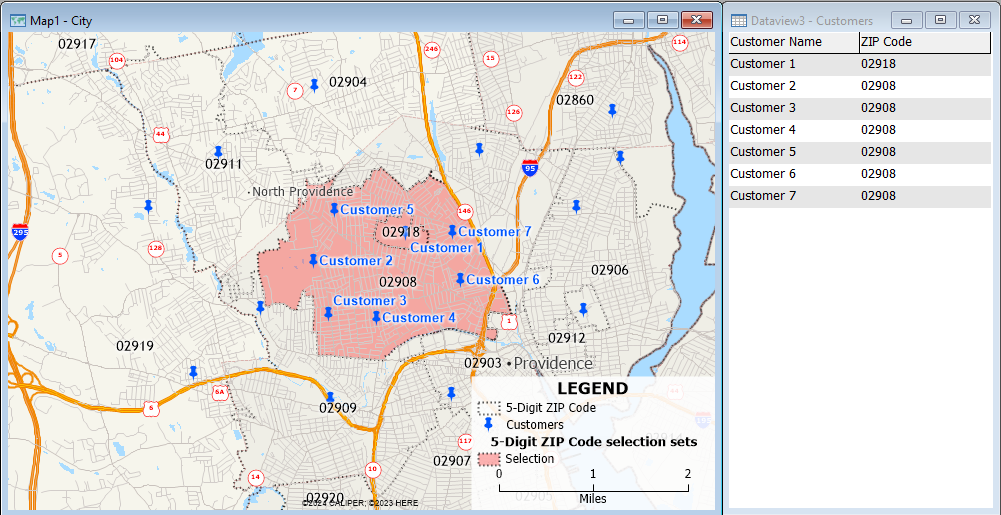
Using the selection tools in Maptitude, you can target ads to potential customers in specific geographic areas.
You can follow the steps below to select locations that are within a specific set of ZIP Codes:
- Make the 5-Digit ZIP Code layer the working layer.
- Go to Selection>Toolbar to activate the selection toolbar.
- Use the Select by Pointing tool to click on the map to select specific ZIP Codes.
- Make sure that your location layer is visible on the map.
- Click the Export Selection to Excel button in the Selection Toolbar.
Maptitude exports the customers that are contained in the selected ZIP Codes.
This selection process can be automated via the GISDK API.

Personalized Recommendations
With the landmarks and business location data in Maptitude, you can create a personalized list of recommendations for your customers based on your area of interest.
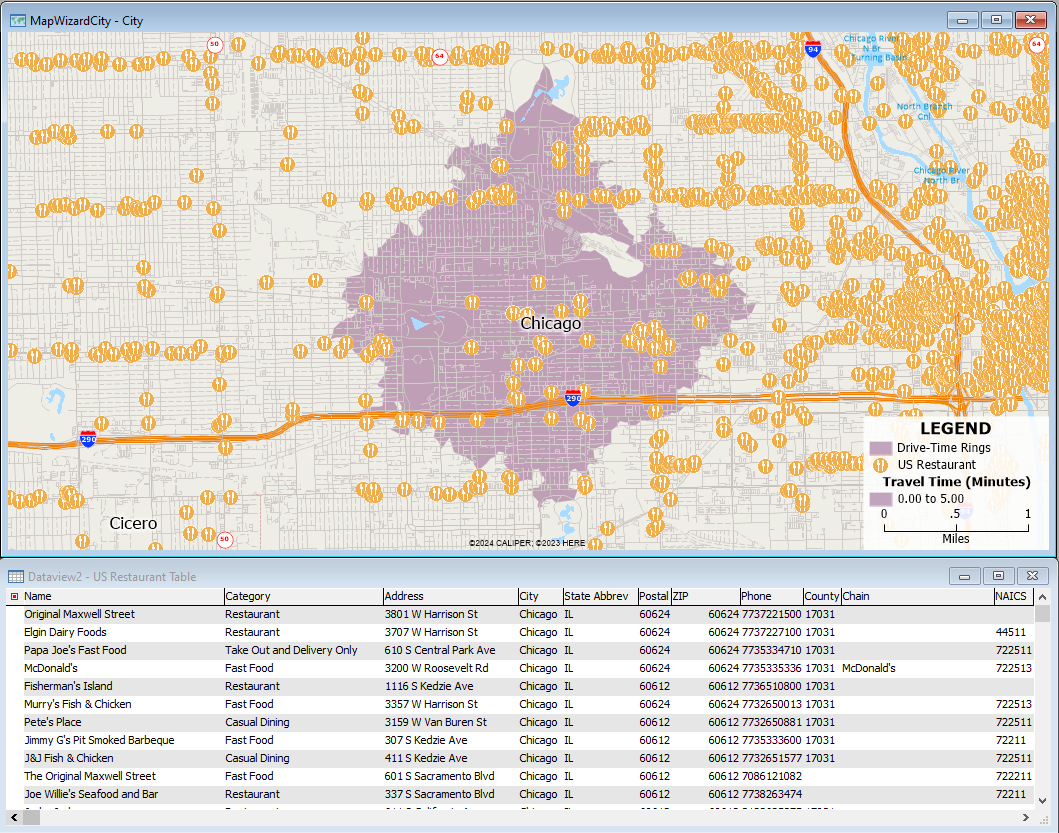
You can follow the steps below to export a list of restaurants within a 5 minute drive from your customer’s location:
- Download and install the Point of Interest free data add-on.
- Add the US Restaurants layer by going to Map>Layers>Add Layer and choosing to open the file “C:\ccdata\USA 2024 Point of Interest (POI) Layers\ntRestaurant.cdf “.
- Go to Tools>Routing & Directions>Drive-time Rings.
- Use the Click Locations button to add one or more locations on the map.
- Choose Shortest for the Route Type and choose to create 1 ring of 5 minute(s).
- Click the Create Drive-time Rings button.
- Use the Display Manager to make sure that the US Restaurants layer is visible on the map.
- Make the Drive-time Rings layer the working layer then go to Tools>Reports>Export to Excel.
Maptitude will show you the 5-minute drive-time ring and export the restaurants within that 5-minute ring to Excel.
This drive-time ring analysis can be automated using the GISDK API.

Market Planning and Decision-Making
The demographic and consumer expenditure data in Maptitude can be leveraged to determine the optimal location for new supermarkets, restaurants, or other businesses.
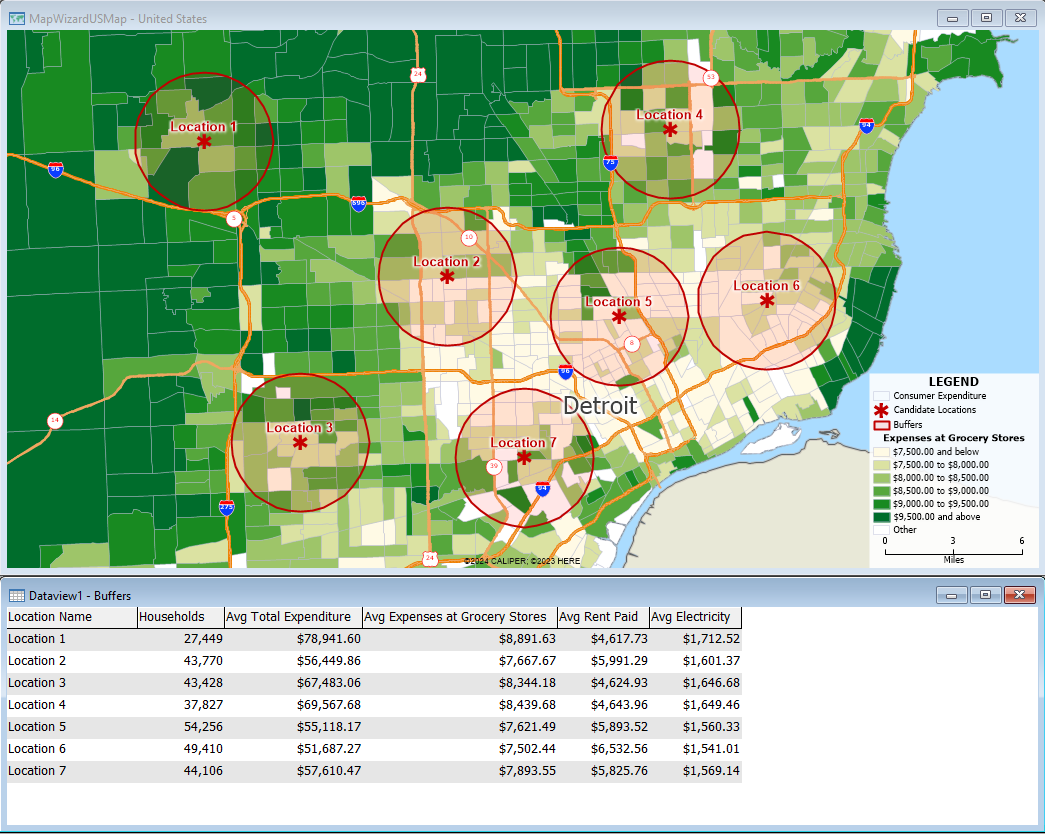
You can follow the steps below to calculate the estimated expenditure for a radius around your candidate locations:
- Map your candidate locations by following the video tutorial on mapping your own data in Maptitude.
- Download and install the Consumer Expenditure free data add-on.
- Make your location layer the working layer.
- Go to Tools>Analysis>Buffers.
- Enter a radius size and check Separate Buffers.
- Check Calculate Demographics and click the Configuration button.
- Change the Overlay with Layer drop down to the Consumer Expenditure layer and click OK.
- Click OK to run the buffer analysis.
Maptitude will show the estimated expenses for various consumer expenditure categories in a radius around your locations.
If you want to identify the best possible location (based on demand and proximity) from a set of candidate locations, you can try the video tutorial for the facility location analysis in Maptitude.

