Last Updated: August 6, 2024
You can calculate market share for three or more brands by using sales mapping software.
You can create a multiple brand Market Share analysis using the Huff Gravity model to compare three or more sets of competing locations by any area (postal/ZIP codes, political/administrative/territory boundaries, etc.). The analysis will estimate the market share for all sets of locations in each area. This article will explain how to use the tool with our free business location layers to compare three major home improvement stores.
1. Download a free mapping software trial of Maptitude Desktop or use your existing Maptitude Desktop license.
2. Download our free business layers by following the Maptitude tutorial article on downloading the business location data. Business locations by name/brand/logo are available for the USA, UK, Ireland, Canada, Australia, Germany, Switzerland, and Austria. But the Point Landmark layer provided with every Maptitude Country Package also includes the locations of thousands of businesses. This dataset has chain names, allowing you to identify and analyze the competitors in your market using selection sets.
3. Open a new workspace and use the above instructions to add “ntHomeDepot.Cdf”, “ntLowes.Cdf” and “ntMenards.Cdf” to your map.
4. Make one of the competitors, US Lowe’s, the working layer.
a. Merge any 2 competitor layers together using Tools>Editing>Merge Layers
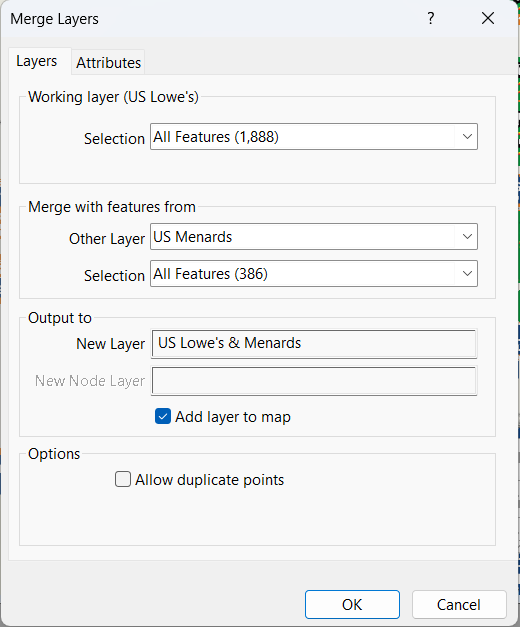
5. Choose Tools>Analysis>Market Share (Huff Model) to display the Market Share Wizard.
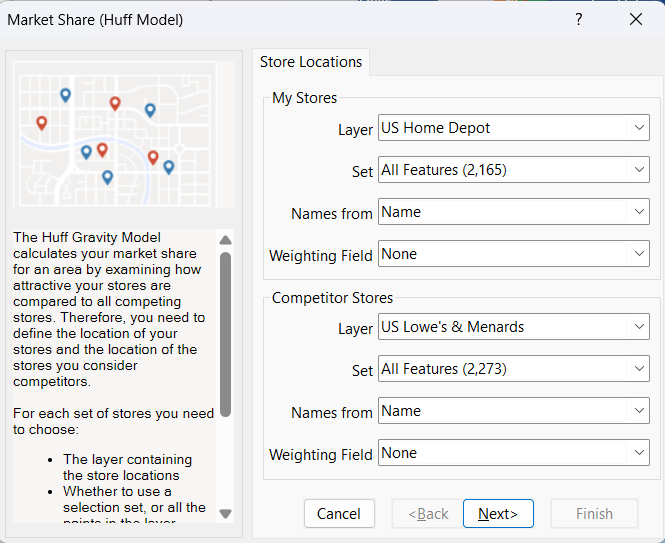
6. Choose the layer containing your facilities from the first Set drop-down list and the layer with the competitors from the second Set drop-down list.
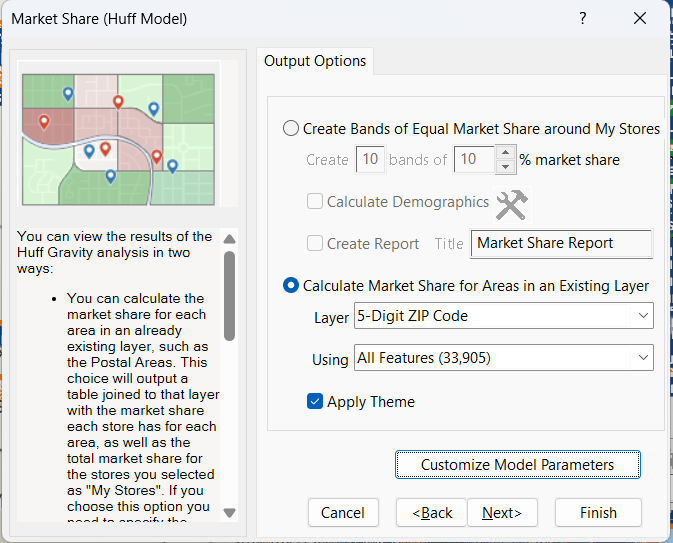
7. Click Next, choose Calculate Market Share for Areas in an Existing Layer, choose an area layer to use (e.g., 5-Digit ZIP Code or County and All Features or Visible Features), and remove the check from the Apply Theme box.
[Warning: it may take a longer time when computing over All Features. Setting to Visible Features will limit the analysis to what is currently in the map window.]
8. Click Finish. For each area Maptitude determines the market share for every store and displays the results:
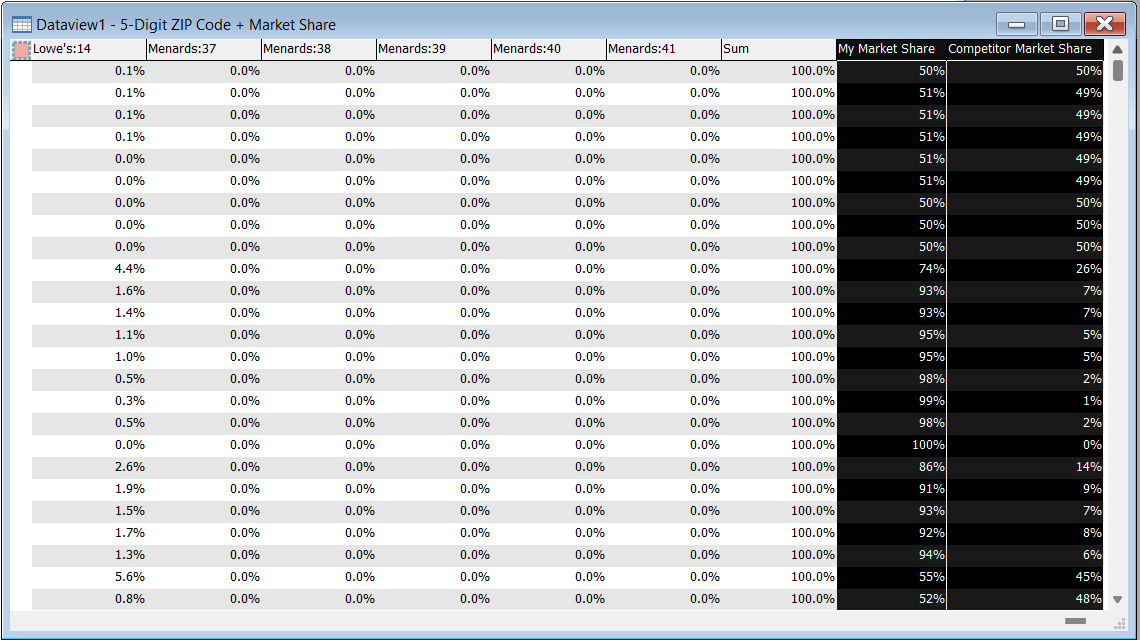
In this example, the My Market Share field contains the Home Depot market share for each ZIP Code and the Competitor Market Share field has the market share for Lowe’s and Menards combined.
9. To determine the market share of just the Menards stores, choose Dataview>Formula Fields and click Statistics.
10. Choose Sum from the Statistic drop-down list and click Choose Fields.
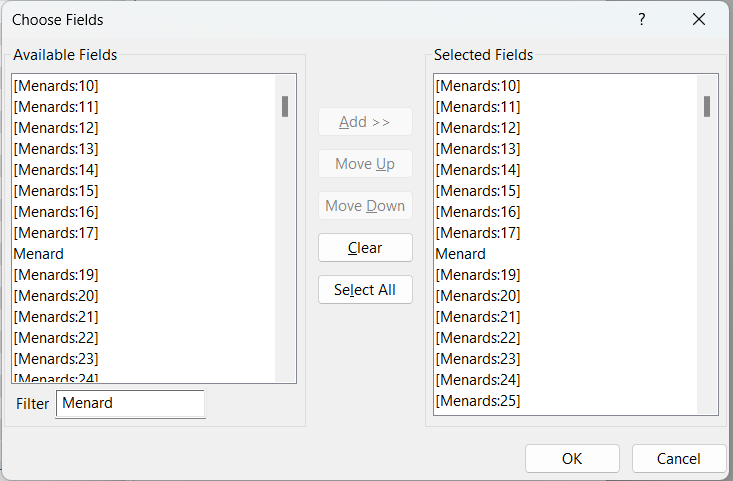
11. Filter the available fields list by typing ”Menard” in the Filter box, click Select All.
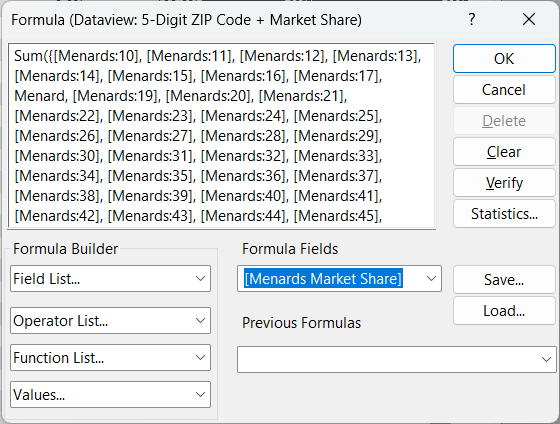
12. Click OK two times to return to the Formula window that now contains a formula for summing all of the Menards market share fields, type “Menards Market Share” in the Fomula Fields box, and click OK.
You now have a field with the Menards share:
13. To compute the share for Lowe’s, choose Dataview>Formula Fields
14. Enter the formula:
[Competitor Market Share] - [Menards Market Share]
and name this formula field “Lowe’s Market Share”.
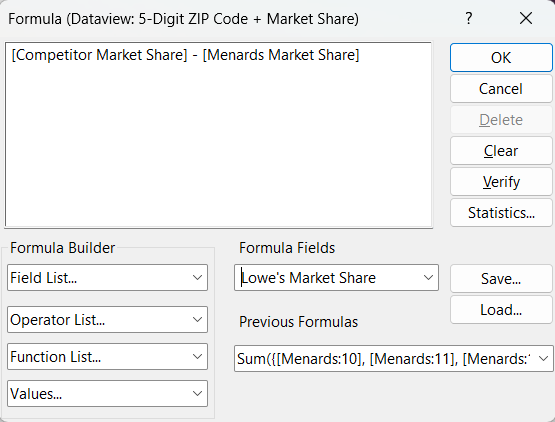
15. Click OK. You now have three fields of market share, My Market Share with the Home Depot share and the two formula fields with the individual market share of the competitors.
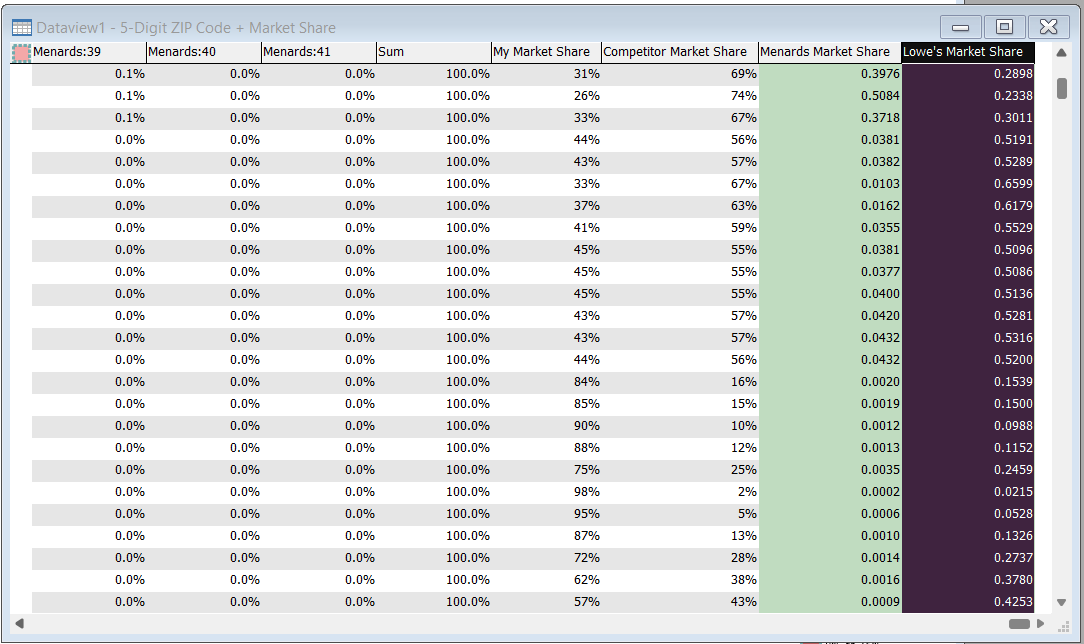
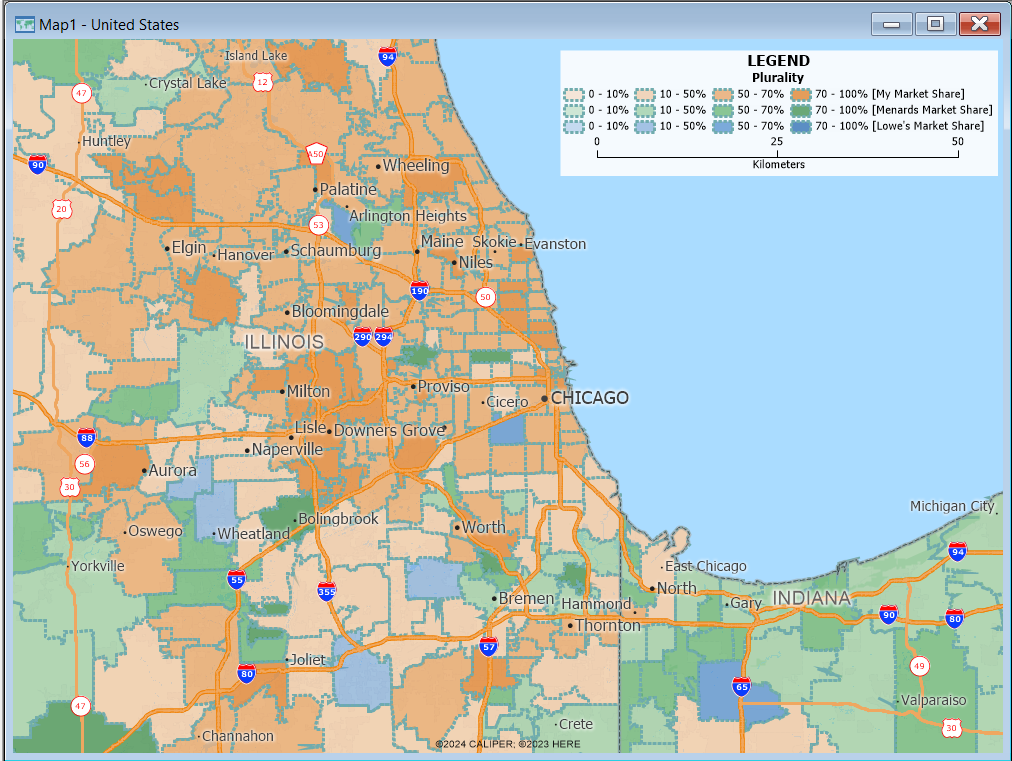
Now that you have the market share of the three different home improvement stores, you can use the multiple fields color theme add-in to visualize which store has the dominant market share in each area and how great that market share is.
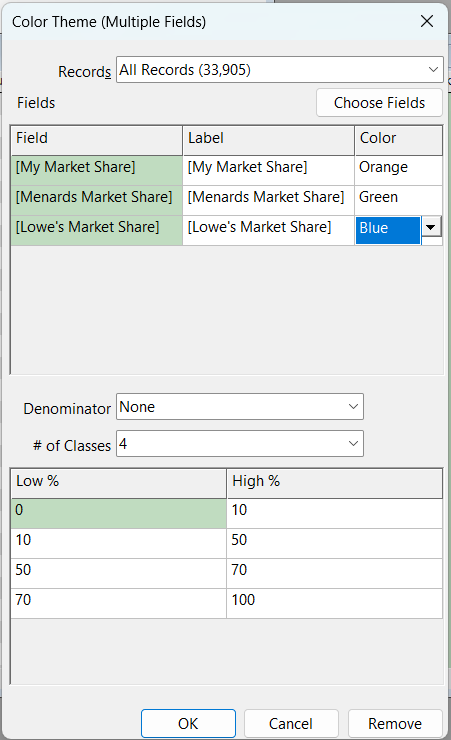
Maptitude makes a new color theme on the county or ZIP Code layer showing the market share of Home Depot, Lowe’s, and Menards locations and updates the legend.
For more information on thematic mapping, please see the Maptitude video tutorial on creating thematic maps.
For more information on mapping businesses, please see the Maptitude tutorial article on mapping businesses by ZIP Code.
You can also predict which of just two sets of competing locations a customer is likely to visit.
