Last Updated: October 11, 2024
You can import, map, and analyze The National Hurricane Center’s (NHC) GIS weather data using mapping software. The NHC provides vital GIS (Geographic Information System) data that is essential for tracking storms, hurricanes, and other severe weather events. For professionals and enthusiasts alike, leveraging this data in Maptitude, a leading GIS software platform, can unlock powerful insights for planning, analysis, and decision-making. In this guide, we will explore how to effectively use NHC GIS data with Maptitude to visualize Hurricane Milton’s wind field, wind radii, forecast track, cone of uncertainty, and watches/warning.
Table of Contents
1. Download and Install Software
2. Accessing NHC GIS Data
3. Importing NHC GIS Data into Maptitude
4. Analyzing NHC Data in Maptitude
Step 1 Download and Install Software
- Download and install a free trial of Maptitude mapping software, or use your own license of desktop Maptitude.
Step 2: Accessing NHC GIS Data
The first step in utilizing NOAA data with Maptitude is accessing the GIS resources available on the National Hurricane Center’s website.
- Visit the NHC GIS page: Navigate to the NHC GIS page where you can find a wide variety of data formats, including shapefiles (.shp), Keyhole Markup Language (.kml), and others.
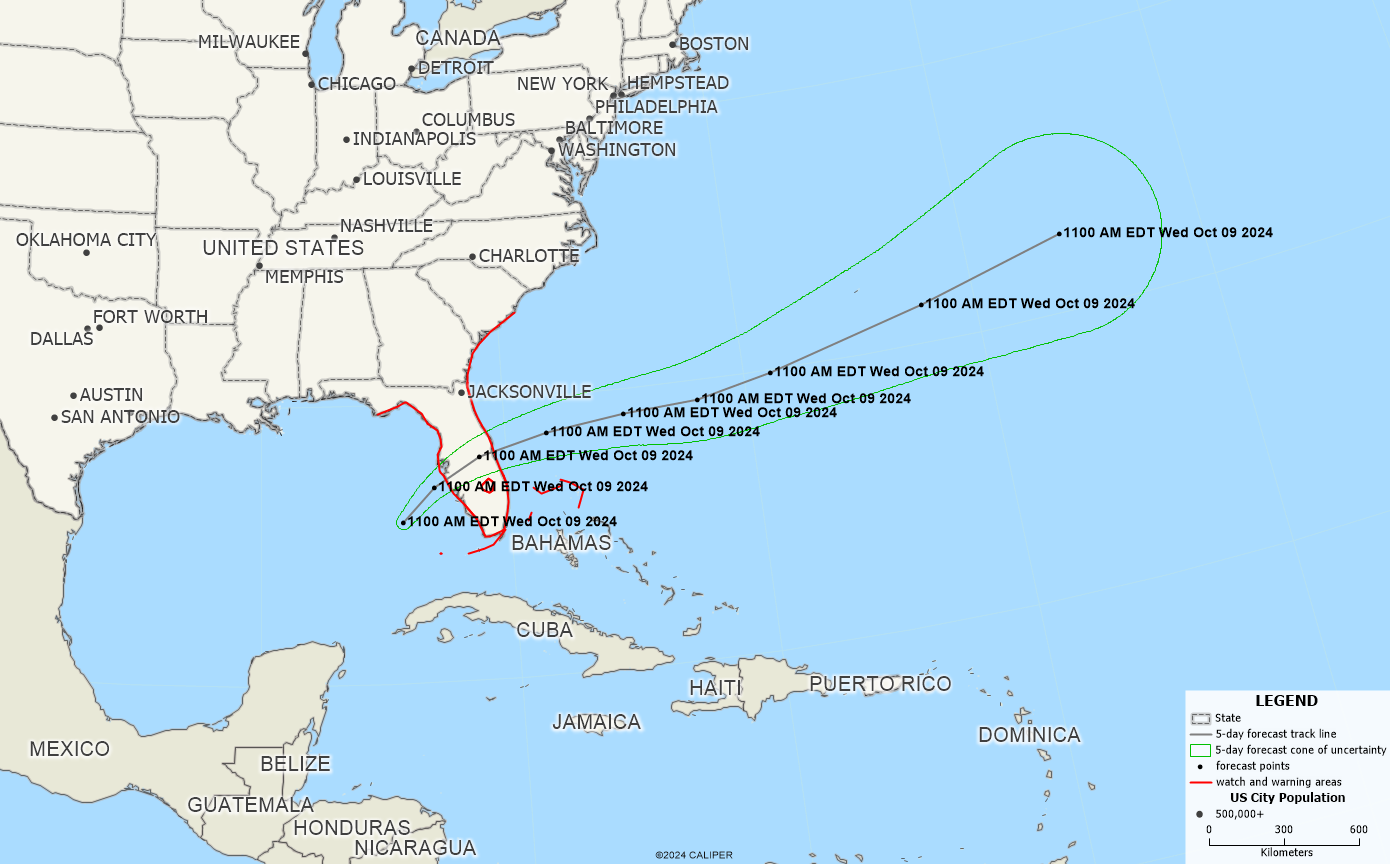
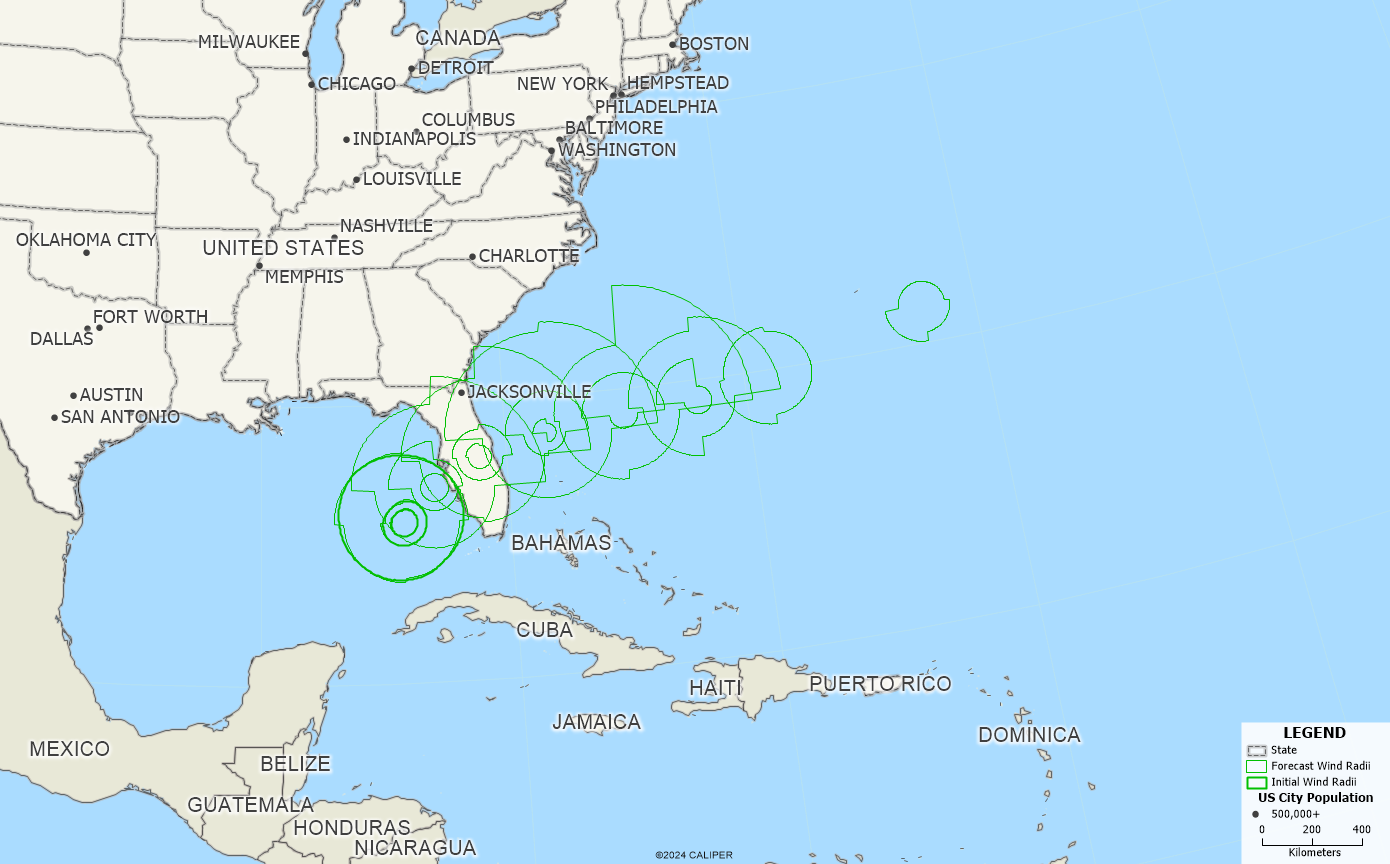
- Select the appropriate data: The NHC provides different data layers such as forecast tracks, cones of uncertainty, wind probabilities, and storm surge maps. Choose the data layers that are most relevant to your analysis. In our case, the layers are the “Advisory Forecast Track, Cone of Uncertainty, and Watches/Warnings” and “Advisory Wind Field and Forecast Wind Radii” for Hurricane Milton.
- Download and extract the data: Once you’ve selected the necessary files, download them to your computer as the NHC’s default .shp file type. After it is downloaded, unzip the folders to extract the data.
Step 3: Importing NOAA GIS Data into Maptitude
Once you’ve obtained the NOAA GIS data, the next step is to import it into Maptitude for further analysis.
- Open Maptitude: Start by launching Maptitude software.
- Create a new map: Go to New map of United States > United States > Finish
- Import the NOAA shapefiles:
- In the top menu, click Map > Layers… > Add Layer
- Navigate to the folder where you downloaded the GIS data and select the appropriate files. Make sure you are filtering for .shp files.
- Follow the prompts to add the data to your map.
- Review and adjust the map layers: Once imported, the data will appear as new map layers. You can adjust the styling, layer order, and labeling to make the information more accessible and visually intuitive.
- Add label with time column: One great way to label the map is to utilize the time column in each of these imported layers. For example, you can label the forecast points with the associated dates by going to Map > Layers… > Click on the forecast point layer > Labels… Then, under Field you can select any of the date-time columns, such as ‘ADVDATE’ or ‘DATELBL’ depending on the format that is most relevant to you.
Step 4: Analyzing NHC Data in Maptitude
Now that your GIS data is imported, you can begin analyzing and visualizing the information. Maptitude’s powerful GIS tools enable you to perform various types of spatial analysis.
- Overlay Weather Data with Other Layers:
- You can overlay hurricane tracks, cones of uncertainty, or wind probabilities with other layers, such as population density, critical infrastructure, or transportation routes.
- This helps to assess the potential impact of severe weather on communities and essential services.
- Create Buffers and Zones of Impact:
- Use Maptitude’s buffer tool to create zones around a hurricane track or cone. This can help in estimating the areas most likely to experience severe weather conditions, allowing for better preparedness planning.
- Run Proximity Analyses:
- Determine how close key infrastructure or populated areas are to predicted hurricane paths using proximity analysis tools in Maptitude. This information can be vital for emergency management and evacuation planning. Examples of this are locating hospitals or schools in the vicinity of the hurricane.
Conclusion
Utilizing NHC’s GIS data with Maptitude offers a powerful way to visualize and analyze severe weather patterns and their potential impacts. By integrating hurricane tracks, storm surge maps, and other crucial weather data, you can enhance your spatial analyses and support better decision-making in weather forecasting, emergency management, and risk assessment. Whether you are planning for a hurricane’s landfall or assessing its aftermath, Maptitude combined with NHC data provides the tools you need for informed, data-driven decisions.