Last Updated: May 9, 2024
To create sales maps, you can use sales mapping software.
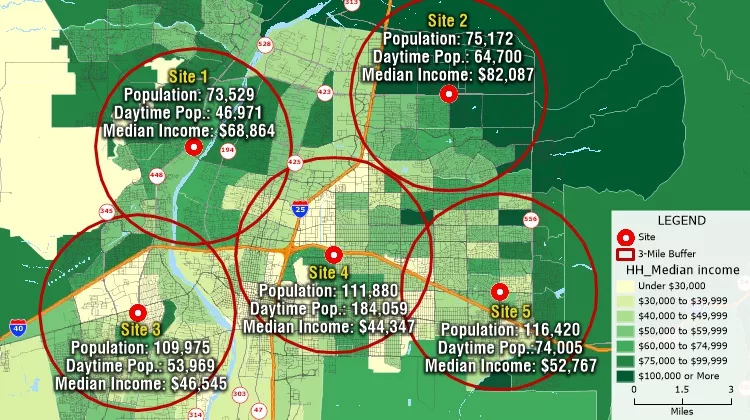
You create a sales map by plotting data points related to past, present, or predicted sales performance on a geographic map. This allows you to visualize and analyze sales patterns in a market, and identify areas that need more attention. Gathering data points can include company purchase and revenue data, market research, competitor information, target demographics, and customer surveys. Use colors and thematics to represent different data points, and consider adding labels to the map to give more information. Once the data is plotted, you can analyze the results to identify potential trends, opportunities, or issues.
Sign up now for a free Maptitude Online or Maptitude desktop account to create your first sales map.
To get started mapping your customer data, you can follow the video tutorial on mapping your own data in Maptitude.
To build sales territories, you can follow the video tutorial on creating territories in Maptitude.
To visualize demographic data, you can follow the video tutorial on thematic maps in Maptitude.

