How do I create a Bubble Map?
How to create a bubble map or size theme using Maptitude
Maptitude Learning Portal articles tagged with Theme
How to create a bubble map or size theme using Maptitude
You can visualize time series data, such as population projections, using Maptitude data visualization software. Three commons ways to visualize time series data in a Maptitude map.
Help on when you can use the Update Linked Records feature in Mapitude
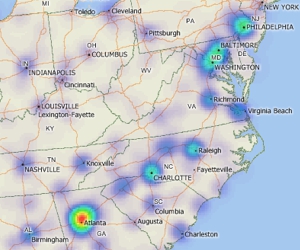
How to use the color and size theme options to create a Glow map on an area layer
How to create and save a color theme with custom icons, then reapply and edit the same theme
How to customize the order of the fields in a chart theme
You can save Pattern and Color Themes to a settings file to use in other maps or on other layers with the same fields. In the Theme Wizard go to Save and either create a new Settings file or save to an existing one.
Using a density grid based on features in a point layer
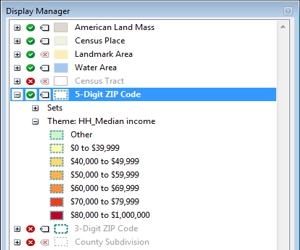
How to change the contents, styles, and labels in a map with the Display Manager
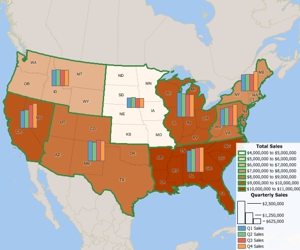
Using the MapWizard® tools to create color/heat themes, chart themes, dot-density themes, 3D themes, and scaled-symbol size themes, pattern and multiple symbol themes, and bubble theme maps.