Last Updated: March 5, 2025
You can access Census Data specific for the Housing Market with real estate mapping software.
Maptitude has information that enables you to make reliable and well-informed judgments based on a variety of demographic and economic data. All the Census boundaries available with Maptitude, as well as 3- and 5-digit ZIP Code areas, include multiple demographic profiles based on Census data and the most recent American Community Survey (ACS) results.
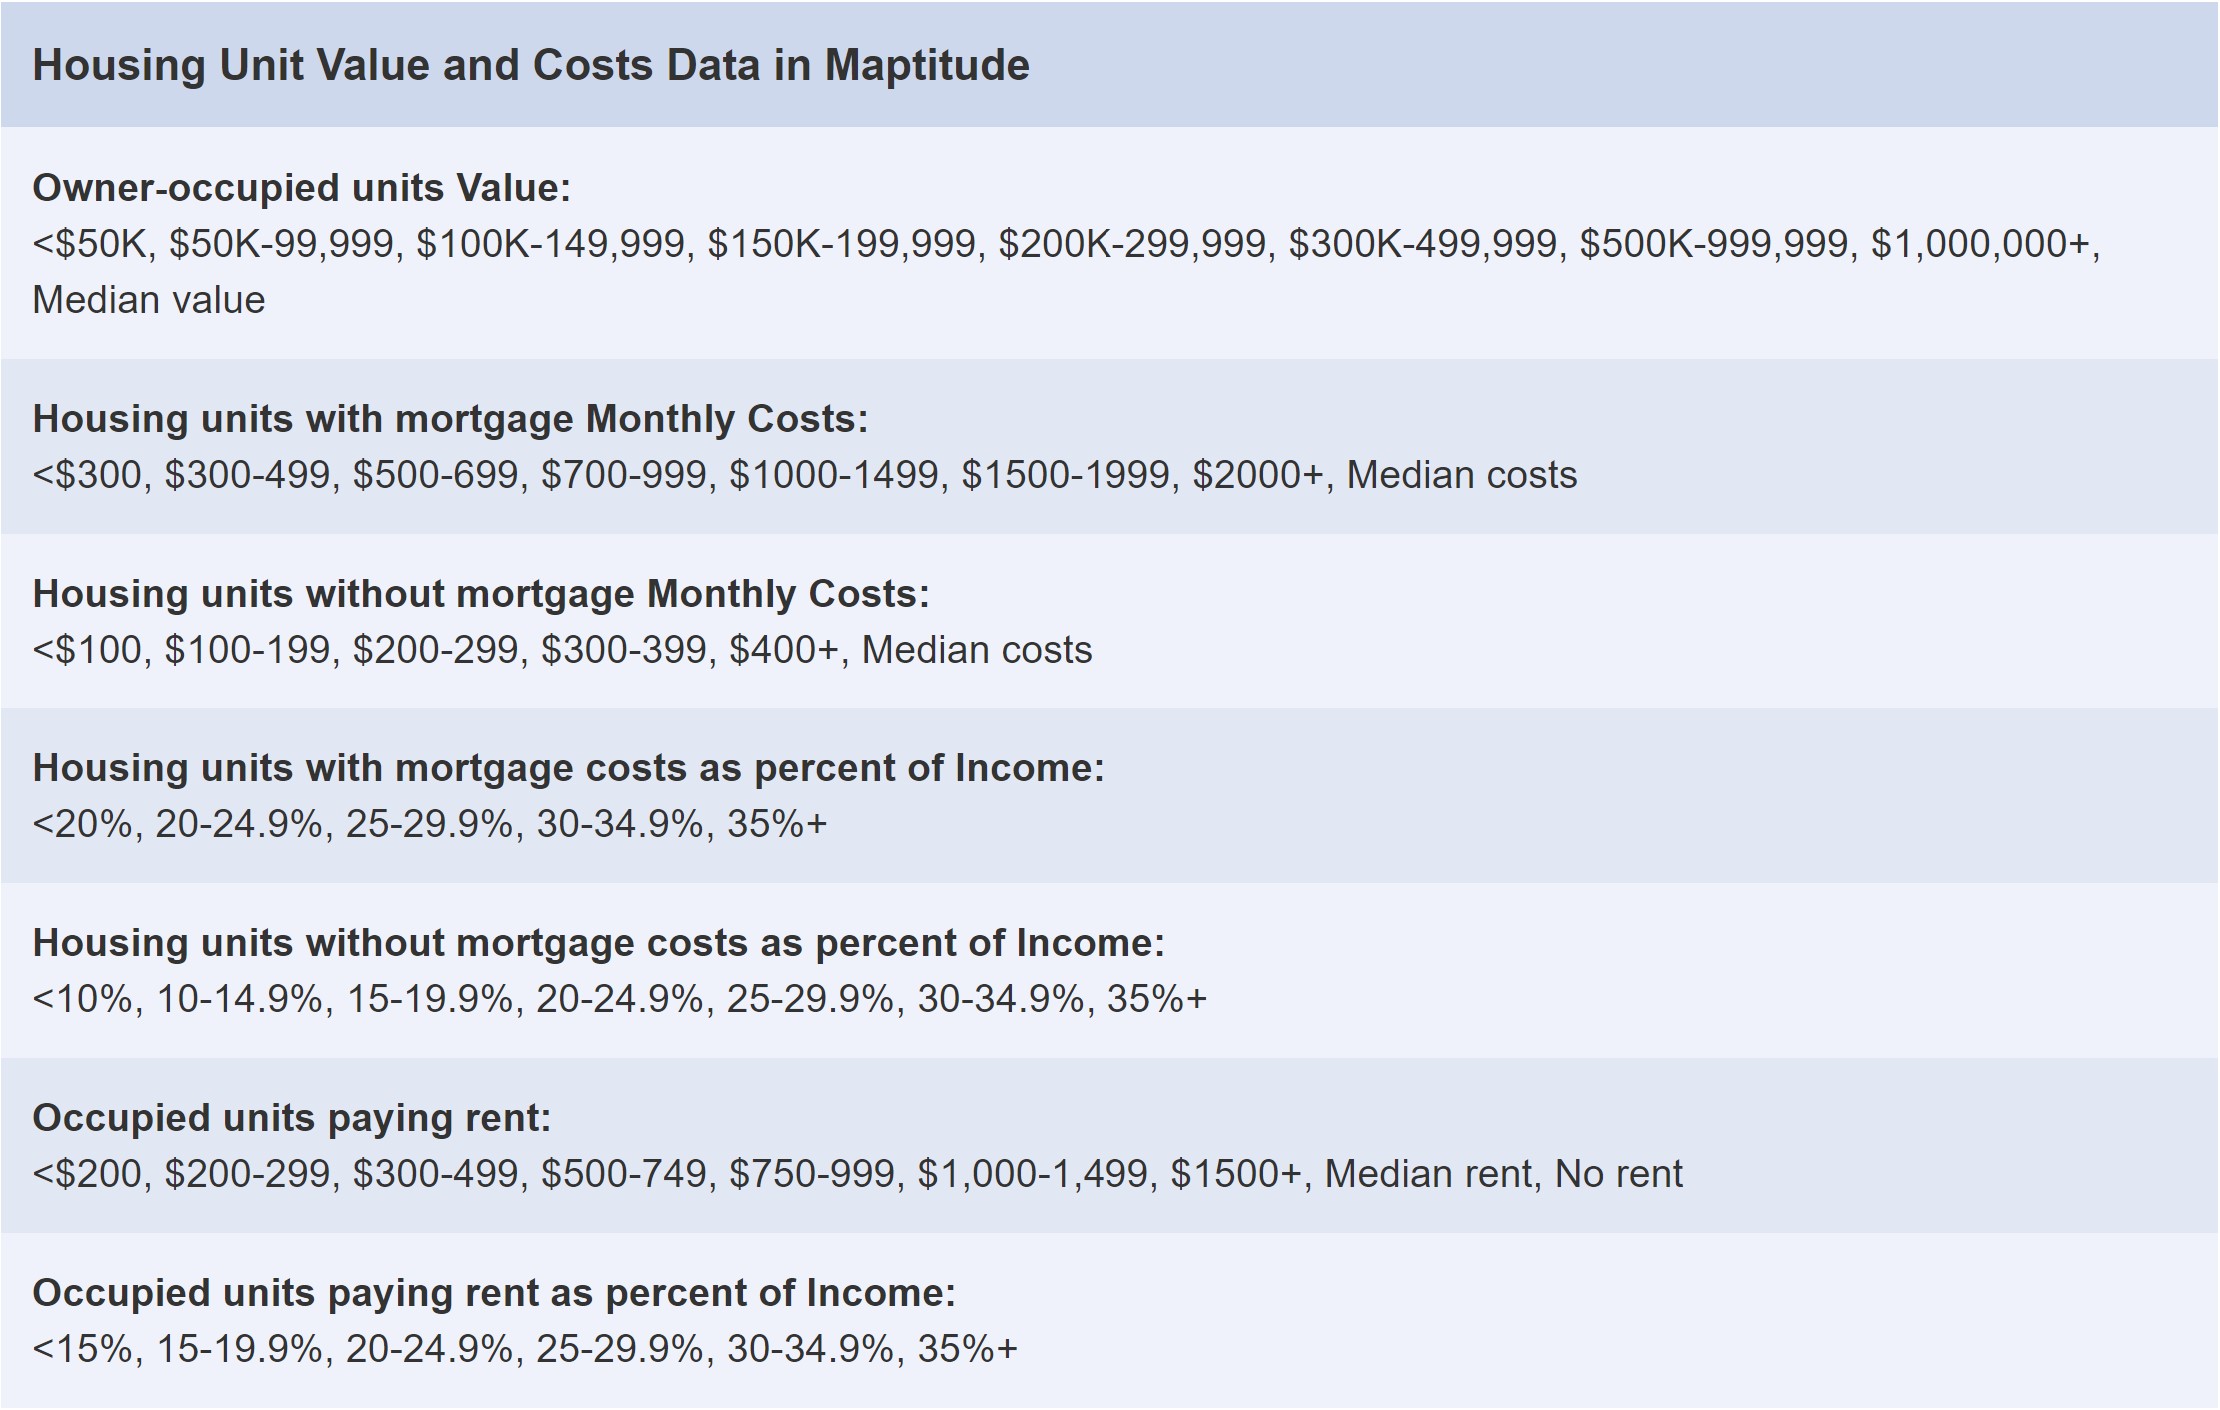
Census and ACS data are provided down to Census Tracts in Maptitude. There are also additional smaller boundaries called Blocks and Block Groups available separately should you need even greater detail. For housing you can map the number of units by value, by mortgage costs and by income, and by rent paid and by income.

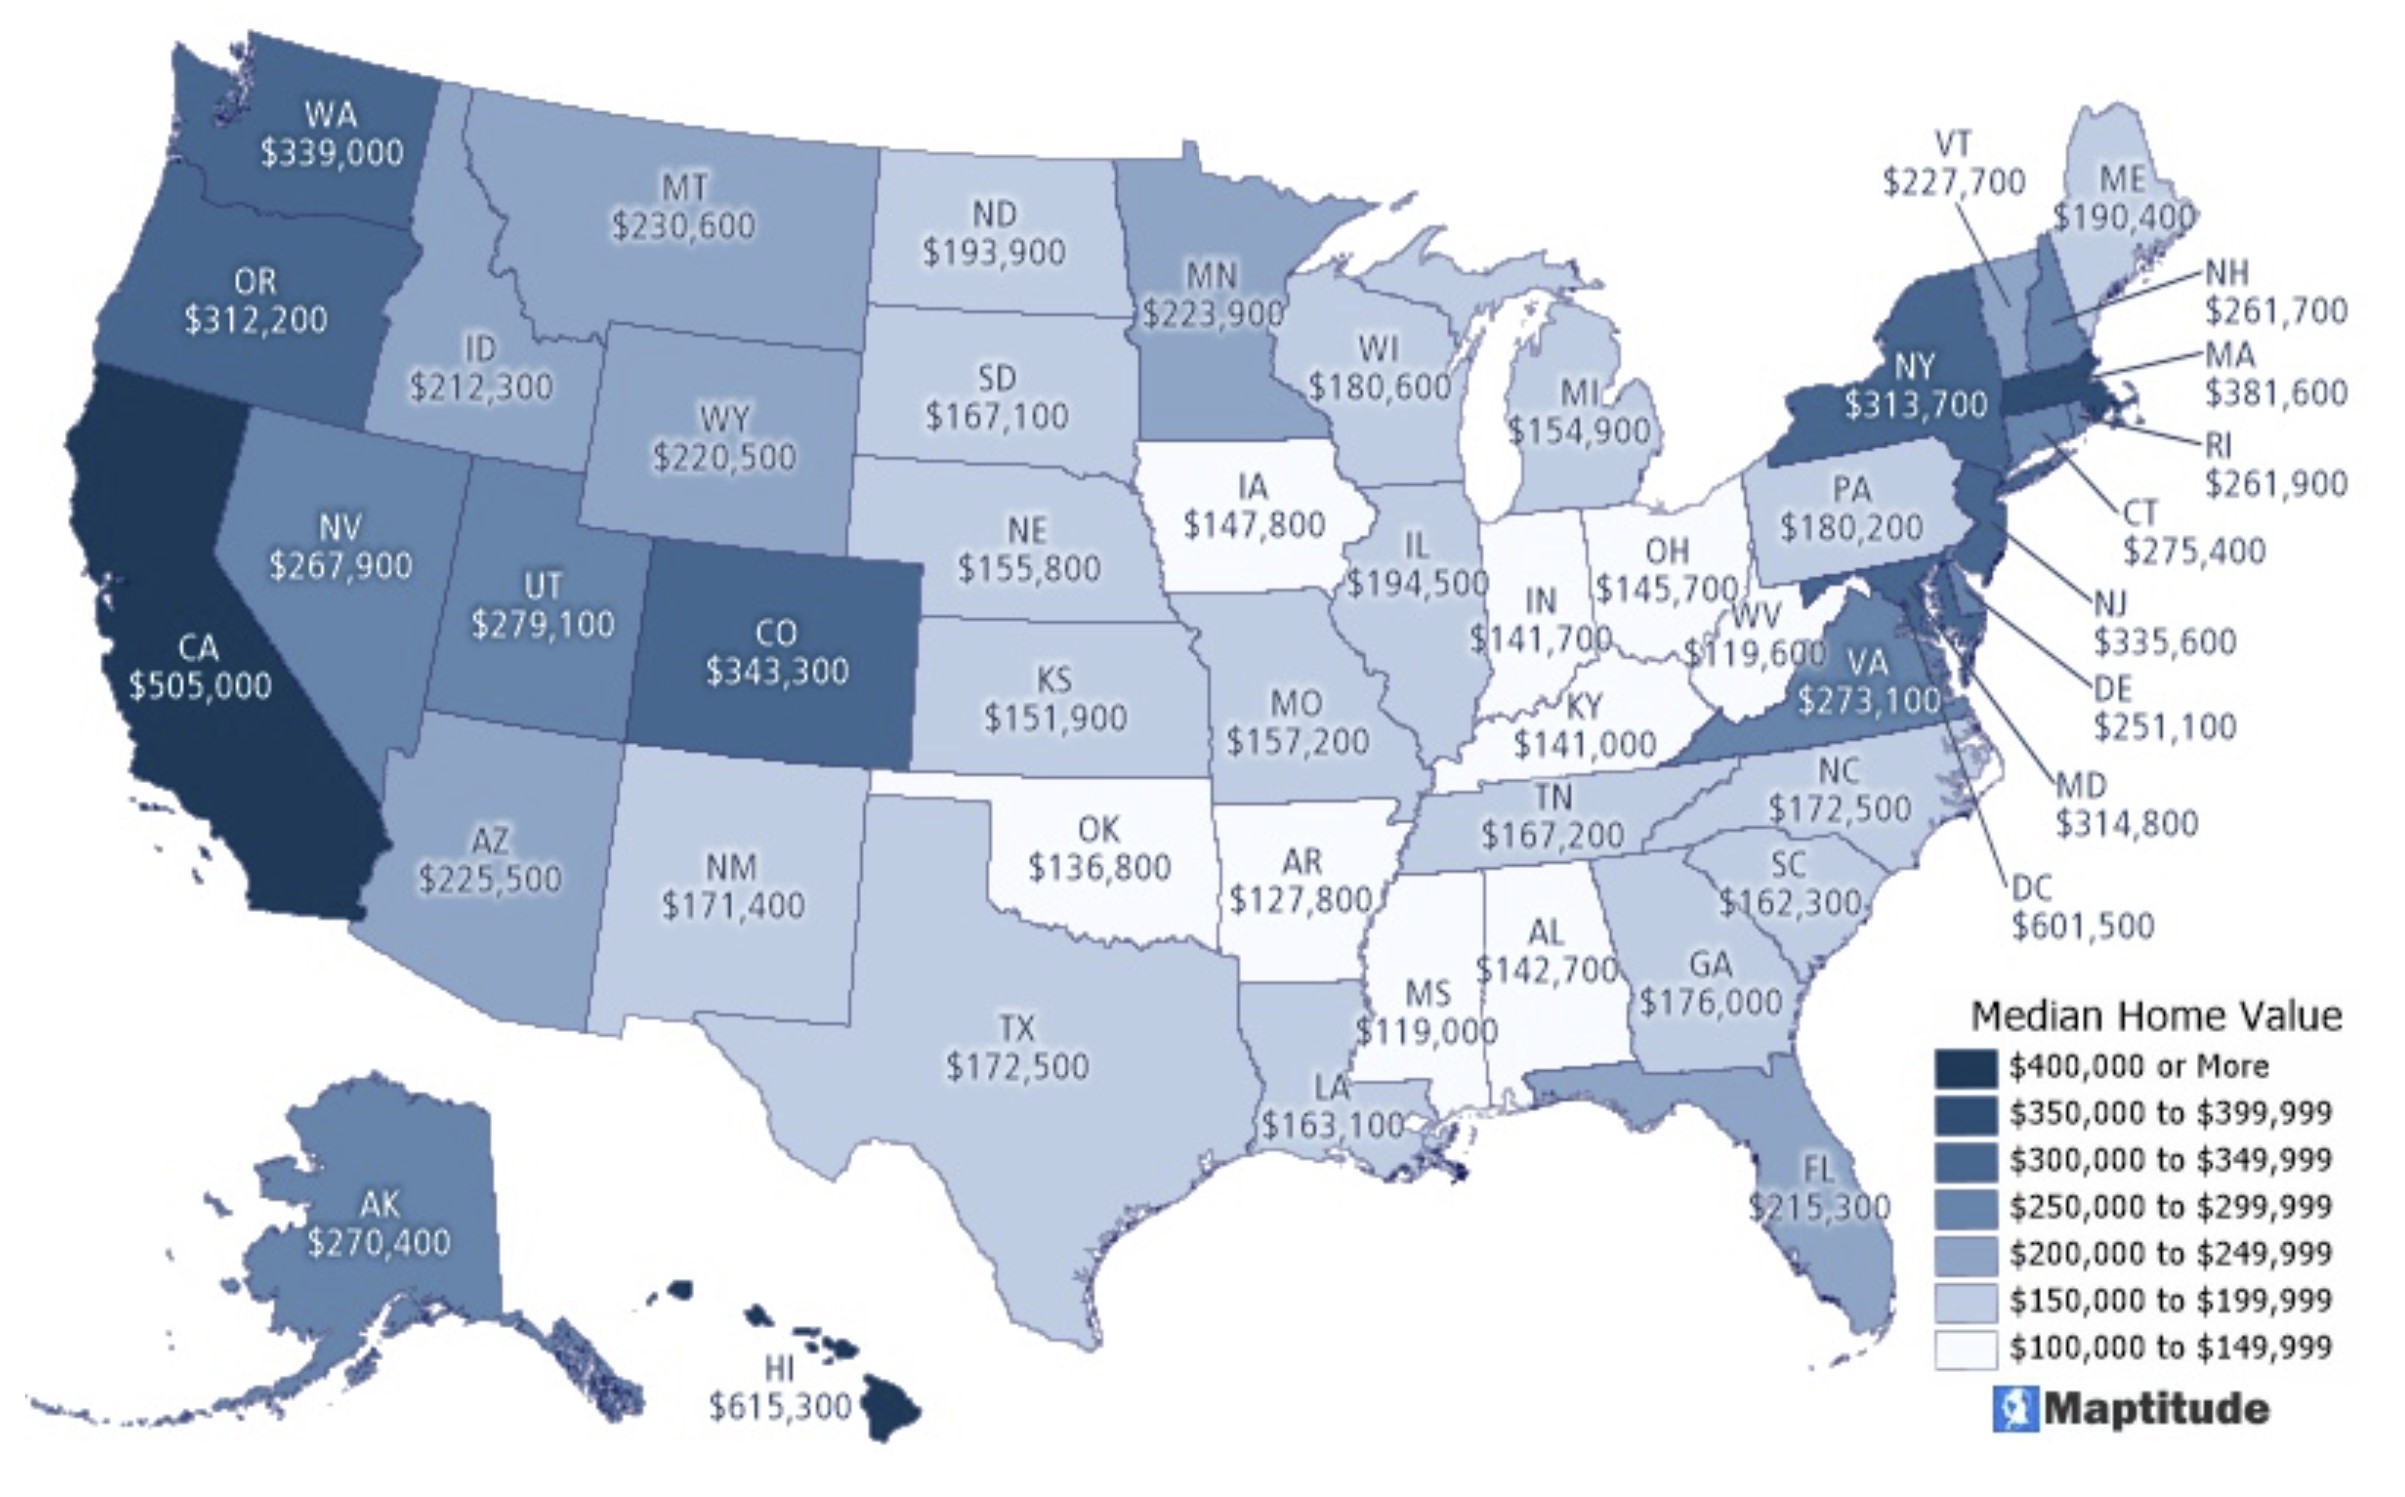
Maptitude makes it easy to explore startling facts such as California, Hawaii, and Washington D.C. having median home values of over $500,000.

For details on how to create a housing map like the above in Maptitude, see Maptitude color theme tutorial article.
For how to bring your own data such as this into Maptitude, see the Maptitude tutorial video on creating a map with your own data.
