|
December 2017 Newsletter |
|||
|
|||
Website | Contact Us | Pricing | Live Demo | Free Trial | Reviews
Does Maptitude Include Premium Demographic Data? Yes!

 For the
USA (international
data is here), Maptitude comes with
- 700+ demographics for most geographies including states and counties
- 550+ variables at the ZIP Code level
- 1,800+ population characteristics at the local level (Census Tracts)
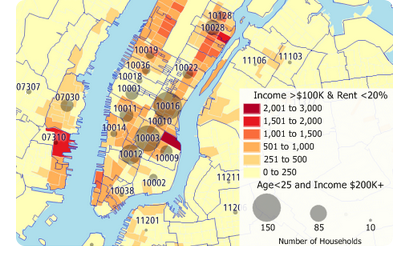
Want to target your product to those ZIP Codes that have the most under 25 year-old householders earning over $200,000? Easy! (That would include ZIP Codes 10016, 10003, and 10012 in Manhattan.)
Want to identify those areas where renters earn more than $100,000 but spend under 20% of their income on rent? A cinch! (That would be the darker red tracts in the Manhattan map)
Whether you want the latest population statistics, the broadest collection of Census data, or future demographic projections, Maptitude has you covered.
The latest demographics are included free with Maptitude 2017 only. Each annual release of Maptitude includes new data, and Maptitude 2017 includes age by income for the first time. Don't have Maptitude 2017? Purchase or upgrade to Maptitude 2017 to use this premium data.
 |
"So we needed a product that would allow us to map where our customers are located and be able to analyze demographics. Overall, considering this is a one time buy and not a SaaS, it has excellent value. The ability to overlay your data with demographic information is awesome." Saige Paget Dental Marketing and Management Group L.L.C. (DMMG) |
Featured Map:
Top 3 States for Highest Income By Age (USA)

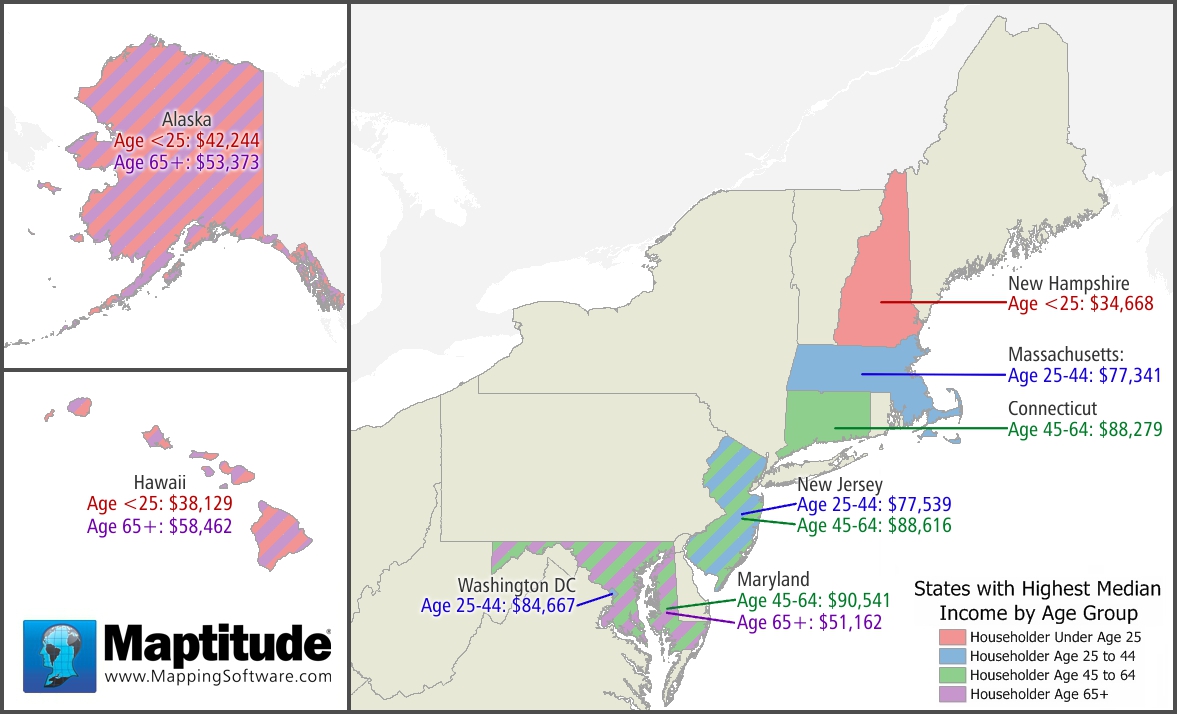
Using the data included with Maptitude 2017 this map shows the three states that have the highest median income for each of four age groups:
- Of those in the under 25 age group, half make over $34,000 in the states of NH, HI, AK.
- Of those in the 25-44 age group, half make over $77,000 in MA, NJ, DC.
- Of those in the 45-64 age group, half make over $88,000 in CT, NJ, MD.
- Of those in the over 65 age group, half make over $51,000 in MD, AK, HI.
So the highest median incomes for all age groups lie in the Northeast corridor, Alaska, or Hawaii. Alaska and Hawaii have the highest median incomes for both the oldest and the youngest people. These higher median incomes may be tied to the fact that the most expensive areas to live in are Hawaii, Alaska, the West Coast, and the Northeast.
Tech Tip:
How Do I Map the "Age of Householder by Household Income" Data Included with Maptitude 2017?

Maptitude 2017 includes 68 fields of data on age of householder by household income. The householder income data is accessible on most of the boundary layers included with Maptitude 2017. In this tech tip we describe how to create thematic maps using this data.
Tricks & Tips:
Finding and Working with Demographics
For the layer that you are interested in, right click on it in the Display Manager (e.g., right-click on State) and choose New Dataview.
»To see a full description of a field:
Hover your mouse cursor over any of the field/column names. For example, hover over HH_Income $10K-14,999 to see $10,000 to $14,999|Estimate|Universe: Total households.
»To see a description of every field:
Right-click on a layer dataview (e.g. the State dataview) and choose Structure to see a new table with descriptions of every field for that layer. Close the Structure dataview when you are done.
»To create a thematic map illustrating the data in one or more fields:
In a layer dataview (e.g. the State dataview) click on a field/column name to highlight the data that you are interested in and choose Map > Thematic Mapping > Color to create a new map. If you highlighted several fields/columns then you can choose Map > Thematic Mapping > Chart.
Learning Maptitude:
Webinars and Training Dates for Maptitude 2017
 |
Upcoming Training: |
|
 |
2017 Webinars (Free)! |
International Mapping:
| www.caliper.com |
Copyright ©2017, Caliper Corporation. All Rights Reserved. |

