|
March 2018 Newsletter |
|||
|
|||
Website | Contact Us | Pricing | Live Demo | Free Trial | Reviews
New Release: Maptitude 2018 Adds Enhanced MapPoint Features!
Maptitude 2018 dominates the space vacated by MapPoint, supporting Microsoft MapPoint-like tools & queries. With enhanced versions of the features that MapPoint users are familiar with, Maptitude retains the ease-of-use of MapPoint while providing functionality that Microsoft MapPoint users could only wish for.
The new and improved tools include:
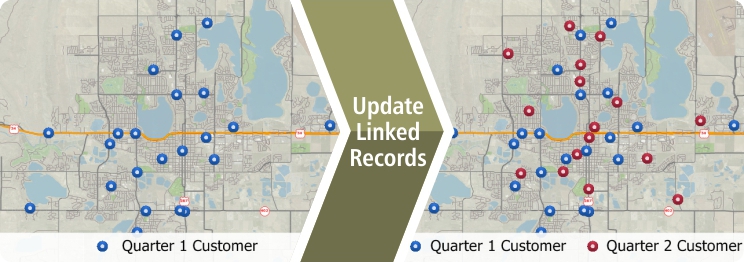
- The ability to link to external data such as an Excel spreadsheet and to update your map layer based on changes in your table without having to reimport your data from scratch More...
- Support for waypoints from MapPoint and Streets & Trips (.PTM, .EST, .AXE) that further helps Maptitude to fill the void since the discontinuation of Microsoft MapPoint
- An updated Create-a-Map Wizard™ that allows you to add shaded boundaries to an existing map
- Improved design for the one-click export to Excel reports
Maptitude tools that were never available in MapPoint:
- A Facility Location wizard for site selection analysis that helps you to identify the best locations for servicing your customers or target market. More...
- A 3-D theme tool that supports the visualization of two columns of data rather than just one, via choices for both color and height, for layers such as postal/ZIP Codes or sales territories. More...
- A distance calculator that can create travel time or distance tables between ZIP Codes or any other layer. More...
Maptitude is Feature Equivalent to MapPoint and supports MapPoint files:
|
|
|

“Ease of moving territories, obtaining census data and plotting territories to that data. Beautiful interface and several ways to customize the product and exports. The ability to pull in my older MapPoint files and data was a huge plus!”
Aaron Wesson |

“Easy to use and speedy to map, comparable for ease of use to the discontinued MapPoint but offers lots of stronger features. The Video tutorials are a really good resource.”
Ben Hutchinson |
Featured Map:
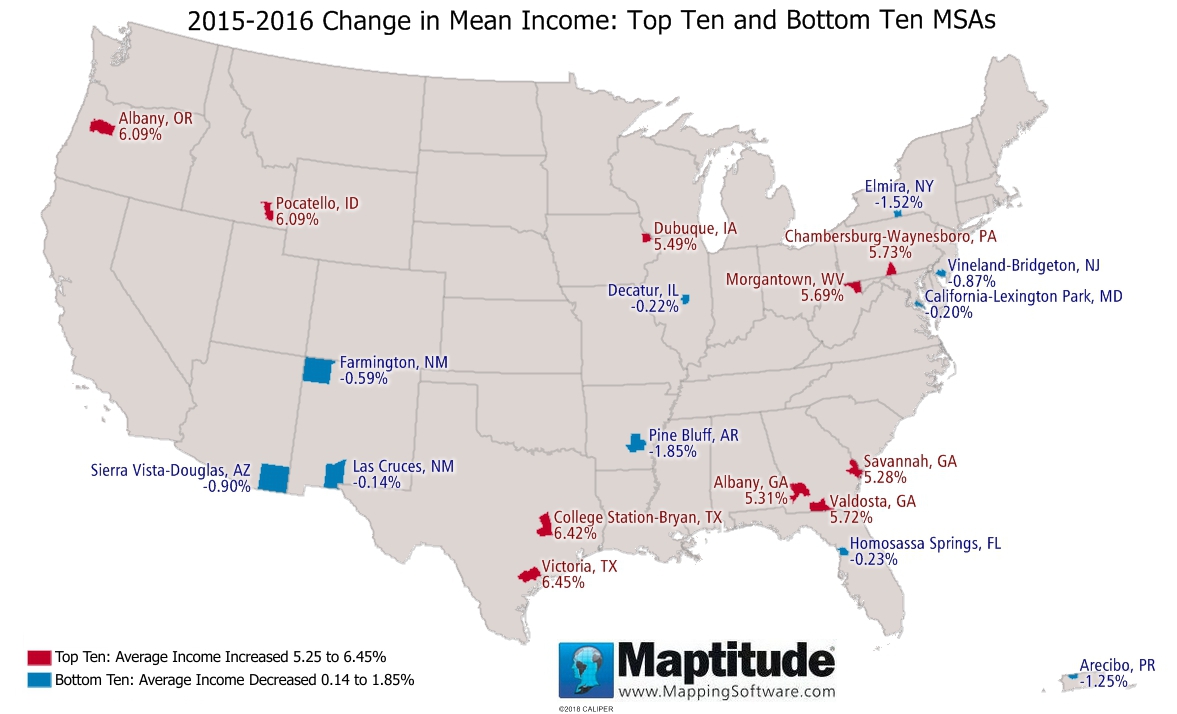
Highest and Lowest Average Income Change by Metropolitan Area

This month's featured map uses the Maptitude 2018 percent change in mean income data for the United States. This data is available for ZIP Codes, Counties, States, and many other layers. The ten metropolitan areas (MSAs) with the greatest positive and negative changes between 2015 and 2016 are shown in the map above. The largest increase in mean income was in Victoria, Texas at (6.45%), followed by College Station/Bryan, Texas (6.42%), and Albany, Oregon and Pocatello, Idaho (6.09%). Pine Bluff, Arkansas (-1.85%) had the largest decrease in mean income, followed by Elmira, New York (-1.52%), and Arecibo, Puerto Rico (-1.25%).
Tech Tip:
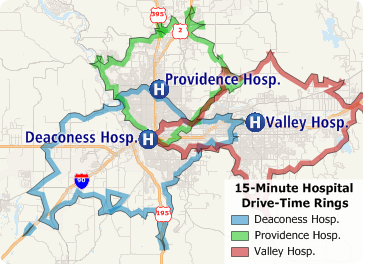
How do I name my drive-time rings and export the results to Excel?

Maptitude 2018 makes it easy to name and identify your drive-time rings, and to quickly export a demographic report for those rings.
Tricks & Tips:
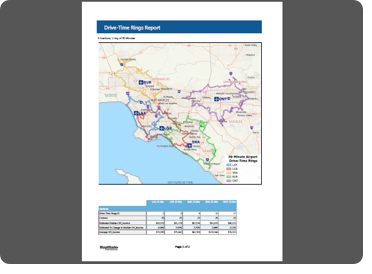
How do I create a PDF report from my drive-time rings analysis?

When
you have followed the steps to create a drive-time ring as shown
in the Tech Tip above or
in this video, you can click
![]() in
the Drive-Time Rings toolbox to create a report for those rings.
in
the Drive-Time Rings toolbox to create a report for those rings.
This report can be saved in many formats simply by choosing File > Export Document and then by choosing one of the formats listed such as PDF File or XLSX File.
Learning Maptitude:
Webinars and Training Dates for Maptitude
 |
Upcoming Training: |
|
 |
2017 Webinars (Free)! |
| News | ||
|
International Mapping:
| www.caliper.com |
Copyright ©2018, Caliper Corporation. All Rights Reserved. |


