Upgrade to Maptitude 2019 for US$395: Last Chance! |

Limited Offer: Valid for desktop licenses older than Maptitude 2017 until June 30, 2019. Restrictions Apply.
|
|
|
|
New Release: 4 Ways Maptitude 2019 Saves You Time & Money |
| Business analysts need to quickly manage and share their maps and data within their team. Franchisors and retailers need their maps to be updated with their latest corporate data. Hospitals and banks need the most up-to-date demographic information. Maptitude 2019 makes it easier than ever to meet these
needs. Here are 4 key areas where Maptitude 2019 will prove
to be critical to your organization: |
|
|
1. Simple File Management
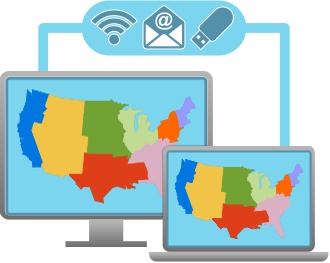
No more layer saving. No more window saving. Just a simple single file for managing and sharing each project.
Maptitude 2019 also
now supports auto-saving in case you lose your work or forget to save it, and file-locking
to prevent accidental file overwriting by other
users.
| Example: You are the primary analyst but need to share your work with other Maptitude users. Save your project as a self-contained compressed workspace (.WRKZ) that you can share over the network or by email.
|
» Learn how in this video tutorial
|
|
|
|
|
2. Data Linking & Updating
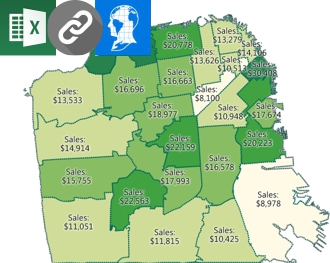
No more importing/copying your tables into Maptitude. Continue managing your data in Excel or SQL Server and use linking to update your maps with any changes in your external tables. Maptitude 2019 now supports linking for boundaries as well as for pushpin locations.
| Example: You can link to data that contains weekly sales figures for your stores so that you can keep the map updated with the latest sales information by ZIP Code area.
|
» Learn how in this video tutorial
|
|
|
|
|
3. Report Customization
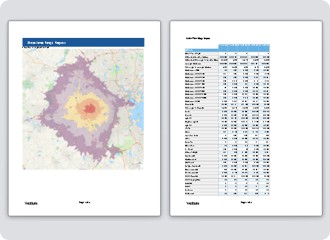
Do you need a specific list of demographics in your reports? Do you need to list the ZIP Codes in each of your areas? The new Report Settings ensure you can see the data that are critical to your analysis.
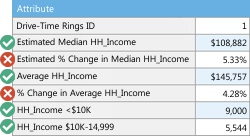
| Example: You can choose to create Export to Excel reports for the median income by race, ethnicity, employment, level of education, families, or for any other demographic that your organization is analyzing.
|
» Learn how here |
|
|
|
|
4. Software and Data
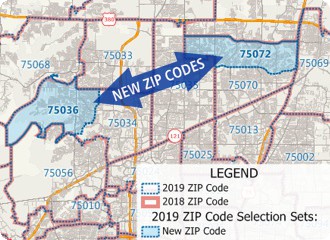
Maptitude 2019 ships with the most up-to-date geographic and demographic information available.
» More
|
|
|
|
There are many more improvements in Maptitude 2019. Please contact the Maptitude Sales Team with any questions. View our new Maptitude 2019 videos here.
|

|
“With a lot of visualization features you can create your own custom sales territories and focus your strategies in a very easy and effective way. Maptitude is the best way to analyze the market in a territory. Great team.”
Eduardo G
Analista Programador de Sistemas |

|
“I am new to the software but am overwhelmed at the ease of using it. The interface is intuitive!...There has been some real thought behind the design/layout. The data is accurate and very visually appealing. What this will mean in understanding the world around me is enormous. I have been able to jump right in and make beautiful, meaningful, and accurate maps. Having the power to analytically divide markets, populations etc., will result in decisions with pinpoint accuracy.”
Brenden Morley
Business Analyst |
|
Featured Map:
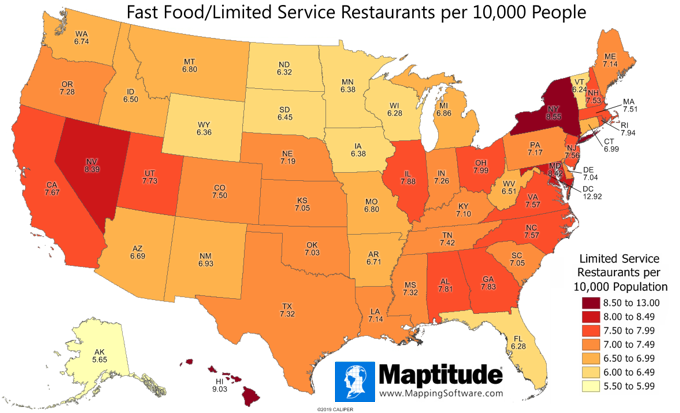
Fast-food restaurants in the USA (Free Maptitude 2019 Data!) |
|
»
More about this map and other featured maps
|
Tech Tip:
How do I customize the Export to Excel report demographics in Maptitude 2019? |
|
|
Maptitude 2019 allows you to choose the demographics shown in your reports. You can specify any of the hundreds of included variables that range from race by income to employment and housing characteristics.
» Learn How Here
|
|
|
Tricks & Tips:
How
to edit the drawing items used to lasso demographics
in Maptitude 2019 |
|
|
Maptitude 2019 makes it easy to edit your drawing items. By using the Freehand Shape tool
 in the drawing toolbar, you can lasso the area that you are interested in. You can then use the Pointer tool in the drawing toolbar, you can lasso the area that you are interested in. You can then use the Pointer tool
 to edit the shape that you drew. Click on the shape edge to add a yellow editing handle and then drag the new handle to edit the shape. to edit the shape that you drew. Click on the shape edge to add a yellow editing handle and then drag the new handle to edit the shape.
Once you are finished editing the shape, simply right-click on the area drawn and choose Export to Excel. |
|
|
Learning:
Training: May 14-16, 2019 • Newton MA, USA • Details | Register
Training: October 8-10, 2019 • Newton MA, USA • Details | Register
Webinars: Schedule and archive
Videos: Maptitude 2019 Videos
Other free mapping and learning resources
|
|
|
| International Mapping:
 |
|
|
|


