Want More Free Premium Data?
Healthcare Layers are Now Updated for Maptitude 2018! |
Don't have Maptitude 2018? Purchase or upgrade to Maptitude 2018 to use this premium healthcare data.
|
|
|
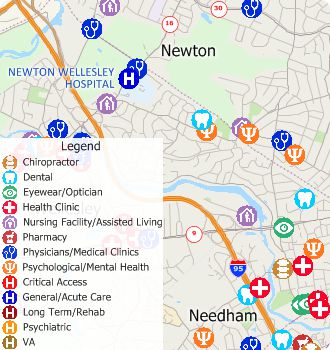
» Five million medical and healthcare providers across the USA have been updated and can be added to any Maptitude 2018 map
» New Primary Care Service Area (PCSA) boundary layer with hundreds of Census variables and healthcare statistics from the Health Resources and Services Administration
» Three updated layers: Healthcare Organization (locations of facilities); Healthcare Provider (individual providers); Hospital
» The two Healthcare layers include the taxonomy codes and descriptions for each location, e.g., General Acute Care Hospital Children (282NC2000X), and Registered Nurse (163W00000X), and you can filter locations by Medicare charges and payments |
|
|
 
|
|
|

|
“This is awesome mapping software. We use it to create heat maps of where our patients live. This allows us to intelligently decide where to add services in our area.” Philip Moya
San Antonio Kidney Disease Center |
|
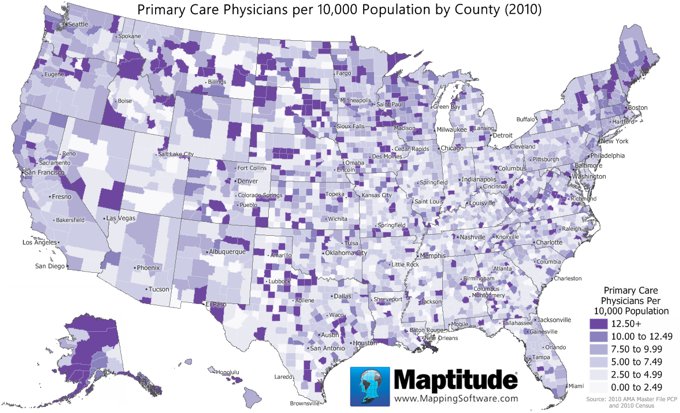
Featured Map:
Primary Care Physicians |

|
»
More about this map and other featured maps
|
Tech Tip:
How Do I Download the Free Healthcare Map Layers for Maptitude 2018 |
|
|
The healthcare map layers for Maptitude 2018 are accessible as a free download. There are four layers as part of this download: Healthcare Organizations, Healthcare Providers, Hospitals, and Primary Care Service Areas. In this tech tip we describe how to install the layers and add them to a map.
» Learn Here
|
|
|
Tricks & Tips:
Performing a Drive-Time Ring Analysis Using the Healthcare Layers |
|
|
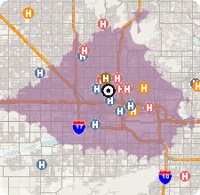
When you have added one of the healthcare point layers to your map as described in the above Tech Tip, you can then perform a drive-time ring analysis on those layers. For example, you could add the Healthcare Organizations layer to the map and then determine which organizations are within a 30-minute drive of a location.
Using the Drive-Time Rings toolbar (
Tools > Routing & Directions > Drive-Time Rings) you can create a drive-time ring around your target location. You can then make the new drive-time layer the working layer and click
 on the Standard toolbar. The resulting Excel file will contain a sheet for each point layer showing exactly which features are in the study area.
If you do not want a certain layer to appear in the report then you can turn the layer off in the Display Manager (e.g., hide the City/Town layer before exporting to Excel to exclude city/town information).
|
|
|
Learning:
Training: October 16-18, 2018 • Newton MA, USA • Details | Register
Webinars: Schedule and archive
Videos: Maptitude 2018 Videos
Other free mapping and learning resources
|
|
|
| International Mapping:  |
|
|
|


