| July 2020 Newsletter |

|

|
| Website | Contact Us | Pricing | Live Demo | Free Demo | Reviews | |
| Learning Maptitude? Online learning resources and virtual live training! |
||||||||
|
||||||||
|
||||||||
|
||||||||
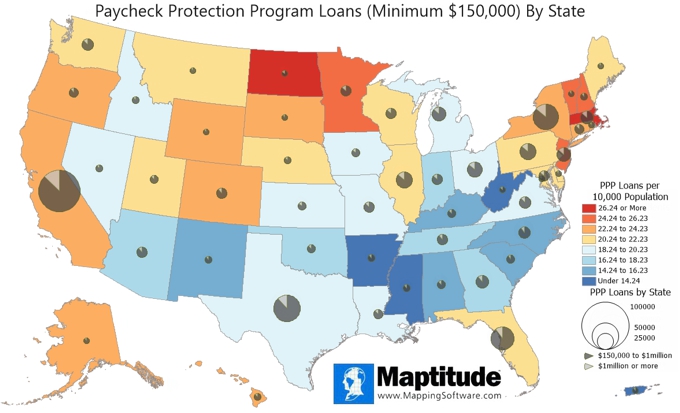
| Featured Map: Highest vs Lowest Number of PPP (Covid-19) Loans by State |
||||||||

|
||||||||
| » More about this map and other featured maps | ||||||||
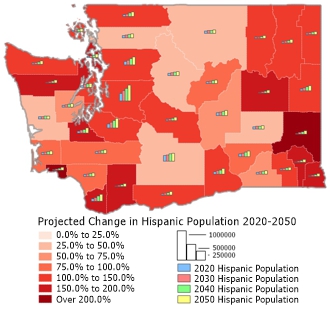
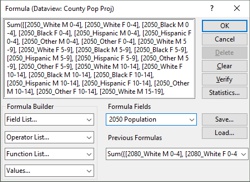
| Tech Tip: How do I create summary fields from the free USA Country demographic projections? |
||||||||
|
||||||||
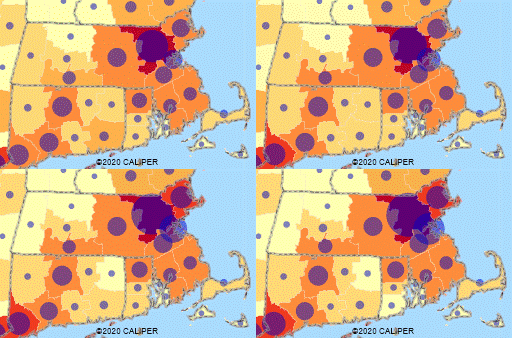
| Tricks & Tips: Visualize changes in data over time |
||||||||
|
||||||||
|
Learning:
Training: October 6-8, 2020 • Virtual Classroom • Details | Register
|
||||||||
| www.MappingSoftware.com | ©2020 Caliper Corp. All Rights Reserved. |
|
Past Maptitude Newsletters |


