| March 2020 Newsletter |

|

|
| Website | Contact Us | Pricing | Live Demo | Free Demo | Reviews | |
 You will quickly find the cost savings & opportunities hidden in your data |
|||||
| Maptitude 2020 has new premium data, new features for MapPoint users, and enhanced analysis tools. | |||||
|
|||||
| Data New data sets for the USA, UK, Canada, and Australia provide access to the most up-to-date geographic information available. Now included for the USA are 54 new columns covering population projections out to 2060, and Gross Domestic Product by industry. More... Faster & More Intuitive Tools Maptitude 2020 is our fastest version yet, with quicker map redrawing, analysis, and download. Better analytics allow you to use any number of potential sites for facility locations, and you can now model long-haul vehicle trips. More... MapPoint Maptitude 2020 now includes one of the best features of Microsoft MapPoint, the ability to copy drawing items between maps to the exact same location. In addition, you can now clearly differentiate points on a map using a numbered symbol theme. Once you have created your maps, use the new PDF export tool that automatically uses landscape or portrait orientation. More... |
|||||
|
|||||
| Featured Map: Grocery Market Analysis: Expenditure, Chain Stores, Geodemographics (New Maptitude 2020 Data and Features!) |
|||||

|
|||||
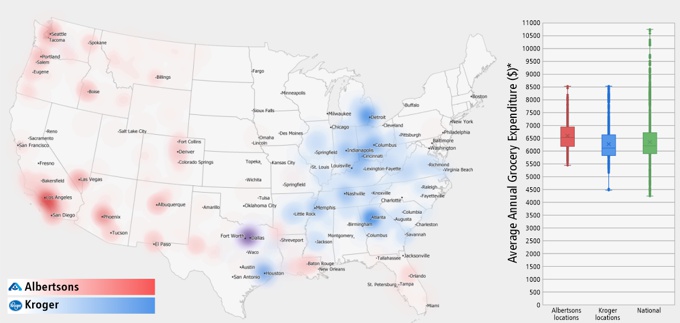
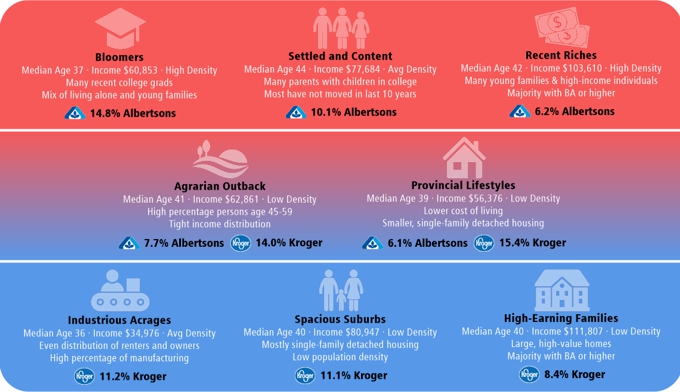
| Maptitude is the perfect tool for market research analysts. Here we explore the landscape occupied by the Kroger and Albertsons grocery store locations. As the map shows, there is minimal footprint overlap between the 2 brands at the national level, with Albertsons primarily in the West, and Kroger in the East. Only the Dallas-Fort Worth area has much territory overlap. As the box plot shows, and based on the Maptitude consumer expenditure data, Kroger locates in areas with lower expenditure on groceries.  The Geodemographic Segmentation data show that Kroger and Albertsons target only some of the same types of people. Overlap occurs only in the "Provincial Lifestyles" and "Agrarian Outbacks" populations. Given these preliminary findings, expansion into each of the other's markets could be possible while not competing directly for the same locations and customers. |
|||||
| Tech Tip: How do I Learn to Use Maptitude 2020? |
|||||
|
|||||
| Tricks & Tips: How do I open maps of the new U.S. demographics in Maptitude 2020? |
|||||
|
|||||
|
Learning:
Training: June 2-4, 2020 • Virtual Classroom • Details | Register
|
|||||
| www.MappingSoftware.com | ©2020 Caliper Corp. All Rights Reserved. |
|
Past Maptitude Newsletters |


