| November 2023 Newsletter |

|

|
| Website | Contact Us | Pricing | Live Demo | Free Demo | Reviews | |
|
Need to share your maps or do basic online mapping? Try Maptitude Online Now: One-Month Trial |
||||||||||
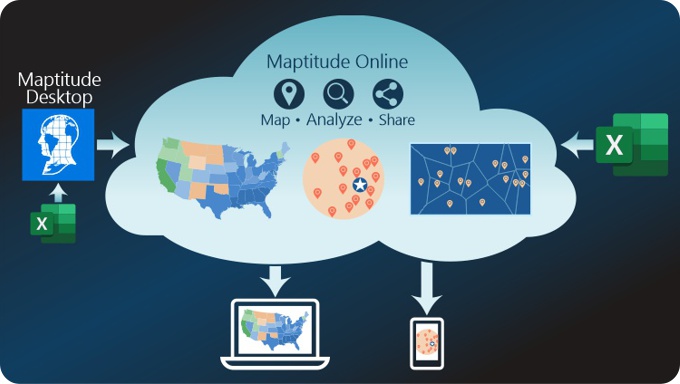
Maptitude Online is both a map sharing add-in for desktop Maptitude and a stand-alone mapping application. If you need to share your results with others:
In addition, even without a copy of desktop Maptitude, any subscriber can:
Visit us for more information on Maptitude Online to start mapping and sharing in the Cloud.
|
||||||||||
|
||||||||||
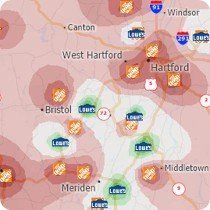
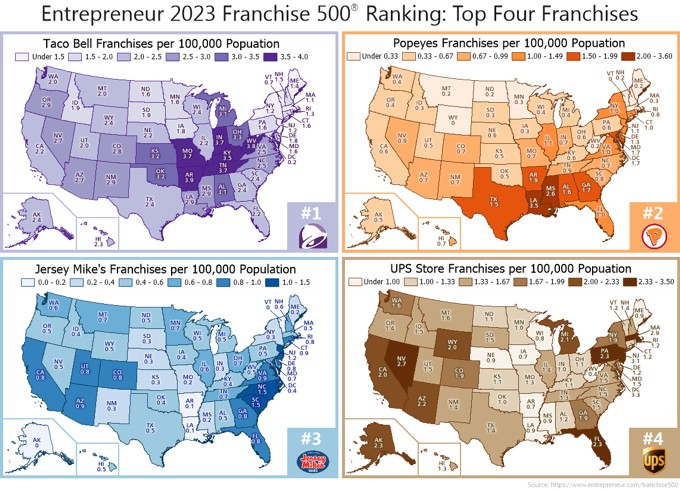
| Featured Map: Top Franchises for 2023 New Maptitude 2023 Business Location Data! |
||||||||||
|
||||||||||
|
Maptitude provides free datasets with the locations of businesses for many countries including the USA, United Kingdom & Ireland, Canada, Australia, and DACH (Germany, Austria, and Switzerland). Updated USA, Australia, Canada, and UK layers for 2023 are available now for Maptitude 2023 users. |
||||||||||
| Tech Tips: | ||||||||||
|
||||||||||
| Maptitude Blog: How to use GIS to look at changes in employment patterns 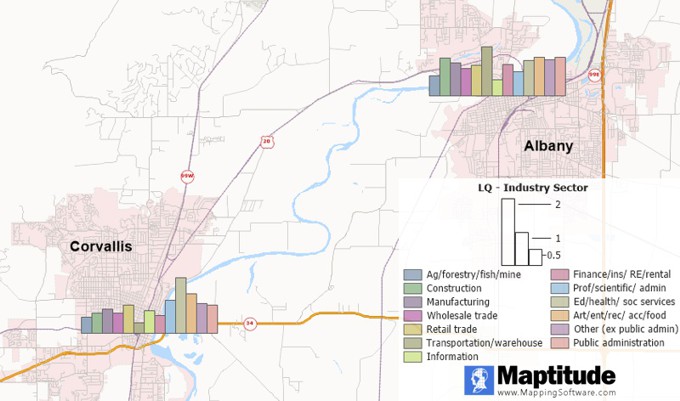
This article explores how to use GIS (geographic information software) in local or regional economics. Many times, local or regional governments, economic geographers or regional economists are asked to look at changes in employment patterns over a specific period within a particular geography (e.g., a city, township, or county) or between several geographies where a comparative analysis is required. |
||||||||||
|
Learning:
Training: Jan. 16-18 • Virtual Classroom • Details | Register
|
||||||||||
|
||||||||||
| www.MappingSoftware.com | ©2023 Caliper Corp. All Rights Reserved. |
|
Past Maptitude Newsletters |

