 to expand
the sidebar and see descriptions of each option in the sidebar.
to expand
the sidebar and see descriptions of each option in the sidebar. tool
to enter Full Screen mode (Press the Esc key to exit full screen
mode)
tool
to enter Full Screen mode (Press the Esc key to exit full screen
mode)Viewing Maptitude Online Maps
You open a Maptitude Online map by clicking on the map card.
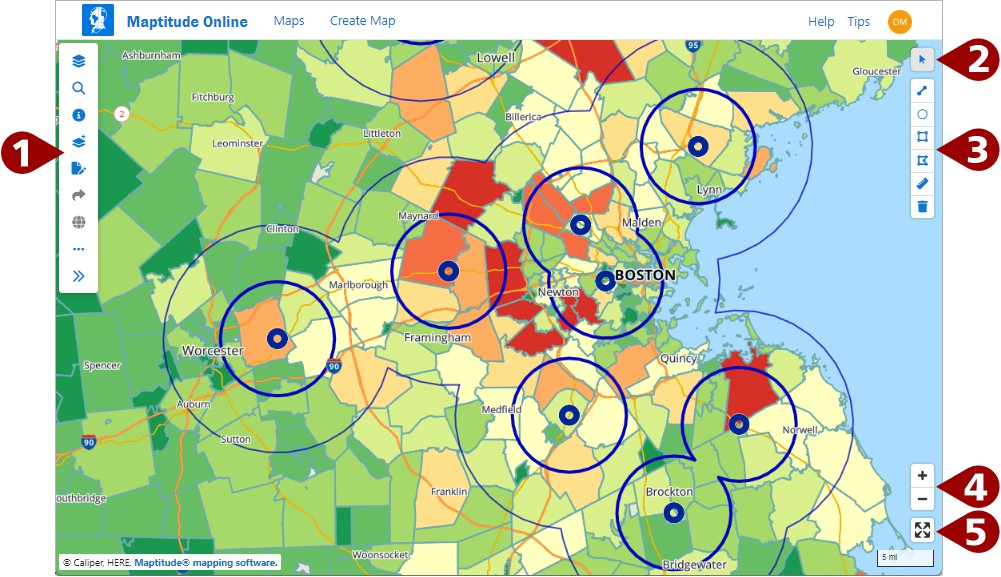
When you open a map, it will contain the following components:
| 1 | A Sidebar
that contains the tools for working with maps. Click to expand
the sidebar and see descriptions of each option in the sidebar. |
| 2 | A Pointer tool |
| 3 | Drawing tools |
| 4 | Navigation tools for zooming in and out |
| 5 | A tool
to enter Full Screen mode (Press the Esc key to exit full screen
mode) |
You use sidebar, navigation tools, and drawing tools to:
The legend displays information about the map, the author, and any team members with whom the map is shared.
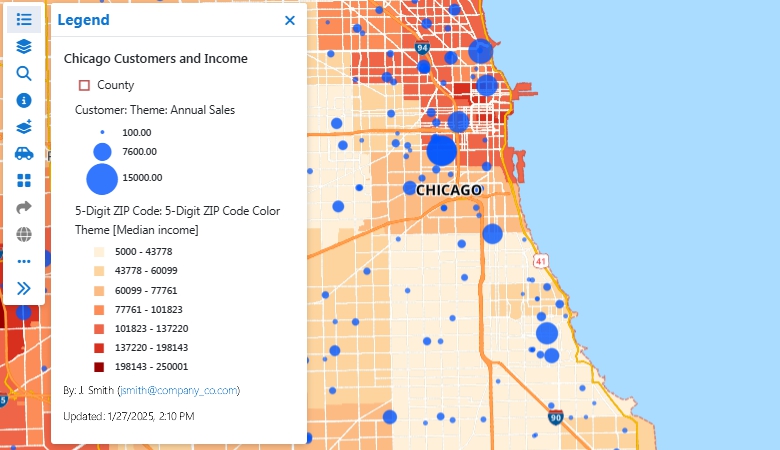
To Display the Legend
 Legend on the sidebar.
 to close the
Legend pane and see more of the map.
to close the
Legend pane and see more of the map.To Export the Legend to an Image File
 Options
on the sidebar and click
Options
on the sidebar and click  Export Legend
Image.
Export Legend
Image.Maptitude Online downloads a PNG image file of the legend.
Changing the Map Scale and Location
Maptitude Online offers a number of different ways for you to display a location of interest including manually zooming and panning, setting the map scale so that all features in a layer are visible, or searching for a specific location of interest.
To Manually Move Around a Map
| To do this... | Do this... |
| Zoom in | Click the + Navigation tool or scroll your mouse wheel away from you. If you are using a phone or tablet, double-tap or pinch-zoom-in. |
| Zoom out | Click the – Navigation tool or scroll your mouse wheel toward you. If you are using a phone or tablet, pinch-zoom-out. |
 |
NOTE:
You cannot pan the map when the Selection
|
To Zoom to a Particular Location
 Search on the sidebar.
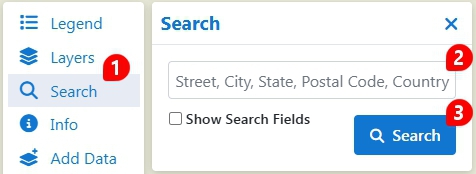 to close the
Search pane and see more of the map.
to close the
Search pane and see more of the map.The map will zoom to the address, city, postal code, or state that you entered.
To Show All of the Features in a Layer
 Layers on the sidebar. .
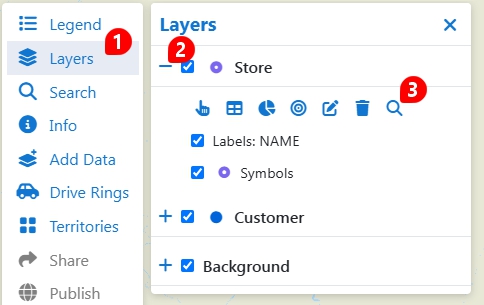 to close the
Layers pane and see more of the map.
to close the
Layers pane and see more of the map.The map will display at a scale such that all of the features in the chosen layer are visible on the map.
Layers on
the sidebar.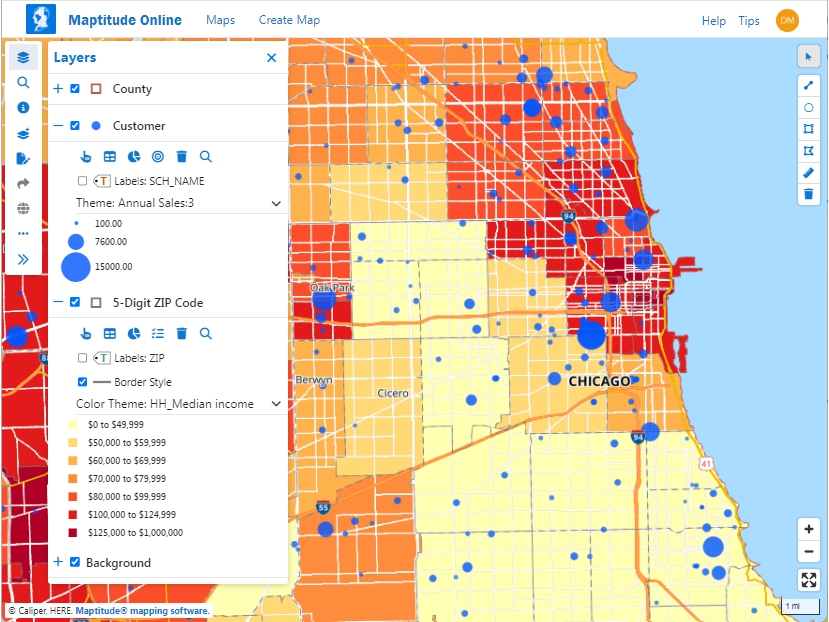
| To do this... | Do this... |
| Rename a layer | Click  , click
the Name tab, edit
the name in the Layer Name
box, and click Finish. , click
the Name tab, edit
the name in the Layer Name
box, and click Finish. |
| Hide a layer, label, or theme | Uncheck the box next to the item you want to hide. |
| Show a layer, label, or theme | Check the box next to the item you want to show. |
| Permanently remove a layer from the map | Click  . . |
| Change the map background | From the drop-down list at the top of the Background section, choose USGS Aerial Imagery to display satellite imagery as the background or choose USA Basemap to display the standard map background. You can also choose to hide basemap layers by unchecking the boxes next to the respective layers. |
to close the
Layers pane and see more of the map.Maptitude Online uses the term style to talk about the colors, symbols, and lines that are used to draw map features. For your point layers, you can control the color and icon used, the size, or upload a custom image file (must be square and an image format such as BMP, ICO, JPG, PNG, SVG). For line layers, you can control the color, dash style, and width. For area layers you can control the boundary color, dash style, width, and fill.
Labels are used to identify the features in a layer by their names or other characteristics. To label features, you choose one or more data fields containing the information you want to see and the label size and color.
You can modify the style and labels of layers that you add to your maps. You cannot change the underlying background layer styles or labels.
To Change the Style of a Point Layer
Layers on
the sidebar.. Maptitude
Online displays the Edit Style window with the Style
tab active.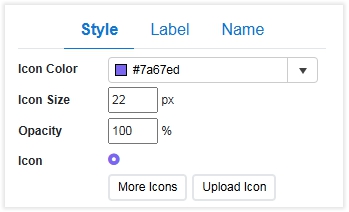
| To do this... | Do this... |
| Change the color of the icon | Click the Icon Color drop-down and choose a color. |
| Change the size of the icon | Use the up and down spinners in the Icon Size box or type a specific value in pixels. |
| Change the opacity of the icon | Use the up and down spinners in the Opacity box or type a specific percentage value. |
| Change the icon | Click More Icons, choose an icon, and click OK. |
| Upload an image file to use | Click Upload Icon, browse for an image file and, click Open. |
To Change the Style of a Line Layer
Layers on
the sidebar.. Maptitude
Online displays the Edit Style window with the Style
tab active.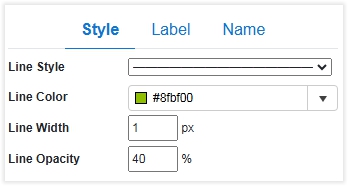
| To do this... | Do this... |
| Change the line style | Click the Line Style drop-down and choose a style.. |
| Change the color of the lines | Click the Line Color drop-down and choose a color. |
| Change the width of the lines | Use the up and down spinners in the Line Width box or type a specific value in pixels. |
| Change the opacity of the lines | Use the up and down spinners in the Line Opacity box or type a specific percentage value. |
To Change the Style of an Area Layer
Layers on
the sidebar.. Maptitude
Online displays the Edit Style window with the Style
tab active.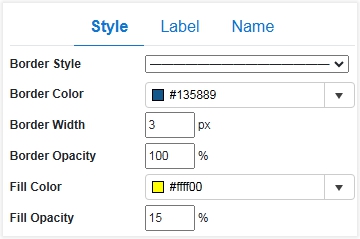
| To do this... | Do this... |
| Change the border style | Click the Border Style drop-down and choose a style. |
| Change the border color | Click the Border Color drop-down and choose a color. |
| Change the border width | Use the up and down spinners in the Border Width box or type a specific value in pixels. |
| Change the opacity of the border | Use the up and down spinners in the Border Opacity box or type a specific percentage value. |
| Change the fill color | Click the Fill Color drop-down and choose a color. |
| Change the opacity of the fill | Use the up and down spinners in the Fill Opacity box or type a specific percentage value. |
Layers on
the sidebar.. Maptitude
Online displays the Edit Style window with the Style
tab active.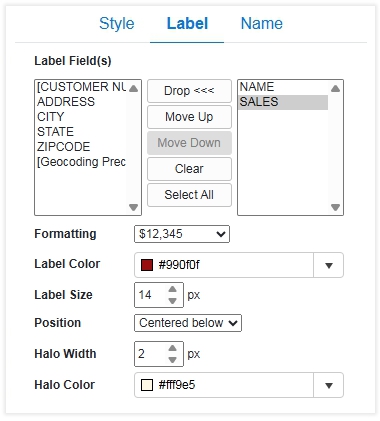
| To do this... | Do this... |
| Choose the field to use for labeling features | Choose fields from the left scroll list and click Add>>>. |
| Remove labels | Choose fields from the right scroll list and click Drop<<< or click Clear to remove all label fields. |
| Change the label color | Click the Label Color drop-down and choose a color. |
| Change the label size | Use the up and down spinners in the Label Size box or type a specific value in pixels. |
| Choose a format for numeric fields | Choose a numeric field in the right scroll list and choose an option from the Formatting drop-down. |
Change the order of label fields |
Choose a field in the right scroll list and click Move Up or Move Down. |
You can use the Drive Ring  tool
to create drive-time or distance rings that show the locations that are
within a certain amount of time (in minutes) or distance (in
miles or kilometers) from one or more origins. You choose the origins
for the rings by clicking on the map or by using features in a point layer.
You then choose the number of rings and the interval.
tool
to create drive-time or distance rings that show the locations that are
within a certain amount of time (in minutes) or distance (in
miles or kilometers) from one or more origins. You choose the origins
for the rings by clicking on the map or by using features in a point layer.
You then choose the number of rings and the interval.
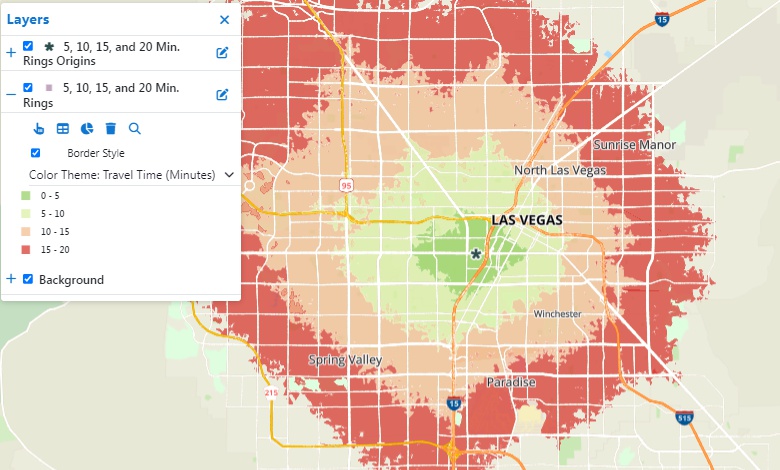
When you create drive-time rings you can choose to calculate demographics for the rings. Maptitude Online will calculate demographics for each individual ring.
When you have more than one origin, you can choose whether the rings are merged or separate. For example:
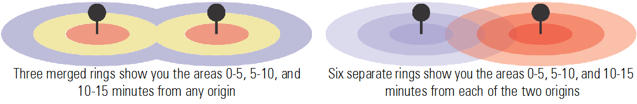
|
NOTE: This feature is available only for roads in the USA. |
To Add Drive-Time Rings to a Map
Drive Rings on the Sidebar. | To do this... | Do this... |
| Choose the origins by clicking on the map | Click  and click on
one or more locations on the map. Maptitude Online displays
a pin icon at each origin location. To remove a location,
click and click on
one or more locations on the map. Maptitude Online displays
a pin icon at each origin location. To remove a location,
click  and click
on a pin icon. and click
on a pin icon. |
| Choose the origins from features in a point layer | If your map contains a point layer, click
 and then choose
a layer to use from the Layer drop-down and choose whether
to use All Features or a selection set from the Using drop-down. and then choose
a layer to use from the Layer drop-down and choose whether
to use All Features or a selection set from the Using drop-down. |
You can use the drawing tools to add a line, circle,
rectangle, or polygon to a map. When you draw features on a map they will
be annotated with their dimensions and name. In addition, you can use
the Pointer  tool on circles,
rectangles, or polygons that you draw to see the estimated demographics
of the populations within those areas.To Show
All of the Features in a Layer
tool on circles,
rectangles, or polygons that you draw to see the estimated demographics
of the populations within those areas.To Show
All of the Features in a Layer
To Use the Drawing Tools
| Tool | How to use it |
Draw Line  |
Click where you want the line to start, single-click to add intermediate points, or double-click to end the line. As you move the cursor, the length of the line will be displayed. |
Draw Circle  |
Click and drag a circle. As you drag, the radius and area will be displayed. Alternatively, you can single-click on the map, enter a radius value, choose the units, and click OK. |
Draw Rectangle  |
Click at one corner of where the rectangle should start. As you drag, the dimensions and area will be displayed. Click again when the rectangle is the desired size. |
Draw Polygon  |
Click at one corner of where the polygon should start. As you drag, the dimensions of the polygon will be displayed. Click at additional locations and double-click to close the polygon. |
| To do this... | Do this... |
| Move an item | Click the Pointer tool
to activate it, click on a line or the border of an area item
to highlight it, click  and click
and drag it to a a new location. and click
and drag it to a a new location. |
| Change the shape of a line or polygon, or resize a circle | Click the Pointer tool
to activate it, click on a line or the border of an area item
to highlight it, click and drag
any of the circular node handles to a new location. |
| Change the name of an item | Click the Pointer tool
to activate it, click on a line or the border of an area item
to highlight it, click  ,
enter a name, and click OK. ,
enter a name, and click OK. |
| Change the measurement units | Click the Pointer tool
to activate it, click on a line or the border of an area item
to highlight it, click ,
choose the units from the drop-down list, and click OK. |
| Hide the dimensions of the drawn items | Click  . Click . Click  to toggle the dimensions back on. to toggle the dimensions back on. |
| Delete an item | Click the Pointer tool
to activate it, click on a line or the border of an area item
to highlight it, click ,
and click Yes to confirm. |
| Delete all drawn items | Click the drawing
tool and click Yes
to confirm. |
If you drew a circle, polygon, or rectangle, you can
use the Pointer tool to see
the estimated demographics of the populations within those areas on the
Info tab.
|
NOTE: Drawing items will not be displayed on publicly shared maps. |
Displaying Information About Individual Features on a Map
You use the Pointer tool to see
information about features on a map or estimates of the demographics for
areas that you draw on a map. You can also display tabular data for an
entire layer. For more information, see Working
with Tabular Data.To Add Drive-Time Rings to a Map
To Display Information About Map Features
tool to activate it and then click (or tap if you are using a phone
or tablet) on a feature on the map or on an area that you added with
the drawing tools. A pin  is added to the map and the
  Info pane will display information for any features near
where you clicked. If features are in more than one layer, use the
drop-down list to choose the layer for which you want to see data.
Info pane will display information for any features near
where you clicked. If features are in more than one layer, use the
drop-down list to choose the layer for which you want to see data.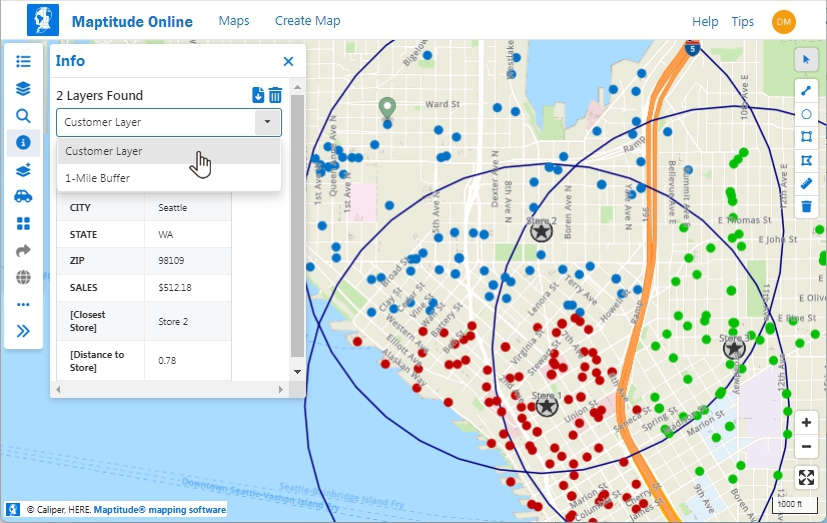
 if you want to
download data for the features to an Excel file.
if you want to
download data for the features to an Excel file. to remove the
pin from the map and clear the Info pane.
to remove the
pin from the map and clear the Info pane.If any PDF reports were uploaded with the map, the Sidebar
will include a  Reports item.
To Display Reports
Reports
on the Sidebar and choose a report. A PDF viewer displays the
report. You can rename, save an image of, copy, or delete an
open map by choosing
Options on the sidebar.
To Manage an Open Map
Options
on the sidebar and make choices as follows:
| Choose this... | To do this... |
| Rename | Display the rename pane where you can enter a new name and click Rename. |
| Export Map Image | Download a PNG file format image of the map. |
| Export Legend Image | Download a PNG file format image of the legend. |
| Make a Copy of this Map | Make a copy of the map. Enter a name for the map copy and click Continue. Maptitude Online closes the map, makes a duplicate, and displays the home desktop with a new map card for the copy. |
| Delete | To display a confirm message that you want to delete the map from Maptitude Online and click Delete. |
©Copyright Caliper Corporation www.caliper.com
 tool is active
nor when the
tool is active
nor when the