|
Sneak Preview:
Maptitude 2016 is Faster & Easier to Use
Maptitude 2016 is due out in the first
quarter of 2016, and we are offering you
an exclusive first look at some of the
new features!
Maptitude 2016 provides the
business value you expect when investing
in mapping software with the most up-to-date and
accurate maps, streets, postal data, and
demographics. With significant
enhancements to map redraw speeds,
territory management, and trip plans,
Maptitude is the fastest and most
intuitive professional mapping
application.
Maptitude 2016 answers specific
operational questions with data driven
solutions. For example, you can ensure balanced and
equal territories using any combination
of demographics or sales data. You can
create multiple vehicle routes, schedule
stops and stop duration, calculate fuel
costs, and create directions.
With enhanced
versions of the features that Microsoft
MapPoint users are familiar with,
Maptitude retains the ease-of-use
of the MapPoint tools while providing
the functionality that Microsoft
users could only wish for.
|
Territory Tools
Businesses require robust
territory creation tools that
excel in both the handling of
data tables and in the visual
manipulation and representation
of service areas. Maptitude 2016
was designed to exceed these
requirements, and provides an
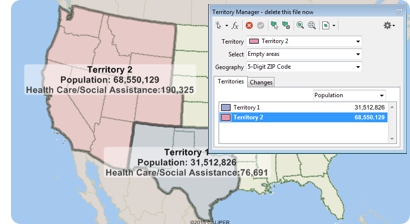
intuitive Territory Wizard and a
sophisticated Territory Manager
with complete undo and redo
support.
Route Manager
You need the ability to
plot accurate stops and to
manipulate, manage, and compare
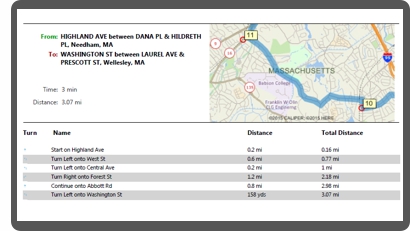
routes. Maptitude 2016 gives you
these capabilities in a simple
tool that allows you to order or
optimize your vehicle visits,
among thousands of stops, and
with variable cost and time per
stop.
New Features
-
Significant speedups in map
display
-
A hover label tool
-
Circle/radius and line
drawing items auto-labelled
with distance
-
Metropolitan area and
3-digit ZIP Code area
mapping (USA)
There are many more improvements in Maptitude 2016! Stay
tuned for additional information. Please
contact the
Maptitude Sales Team with any questions.
|

 |
|
|
Featured Maptitude Map:
2020 Reapportionment
to Shift Political Clout South and West
Every ten years,
something
momentous
happens in U.S.
politics: the
435 House
of
Representative
seats are
reapportioned
among the states
based on the
change in share
of population as
reported in the
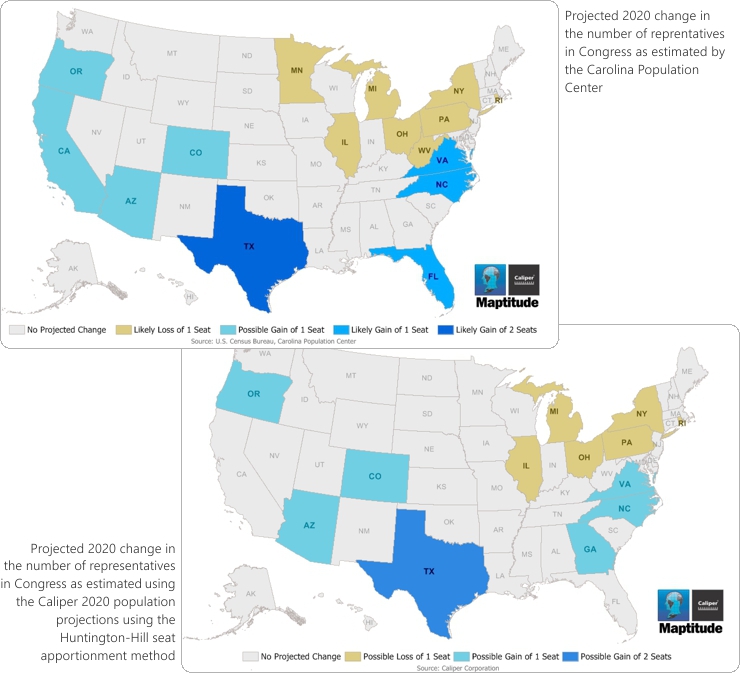
Census. The
UNC-Chapel
Hill's Carolina
Population
Center used data
from a variety
of sources to
predict the
losers and
winners by state
in the 2020
apportionment.
The pattern that
emerges is of a
shift in power
from the
northern USA to
the south and
west. Using the
2020 population
projection data
included with
Maptitude, we
were able to
verify these
projected
trends.

»
See More Featured Maps

|
|
Tricks & Tips:
Visualize
Medicare
Payments by
Physician

You can use a
label and theme
to visualize
the data for point
features in a
map.
In the Display
Manager, make
sure the
Physician layer
is visible and
click on the
label icon, then in the
Field
drop-down,
choose Multiple
Fields.
Follow the
prompts to
choose the
fields you would
like, such as
[Last Name] and
[Medicare
Payments]. When
you are done, make your
Physician layer
the working
layer and then
choose
Map-Scaled
Symbol Theme.
Choose [Medicare
Payments]
for the field
and click
OK.
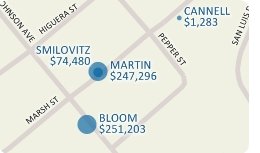
The Physicians
are now scaled
by and labeled
with the
Medicare
payments.
|

