|
New Release:
Maptitude 2016
Adds MapPoint Features & Tools!
 Maptitude 2016
supports Microsoft MapPoint-like tools & queries
and dominates the space vacated by MapPoint. With enhanced versions of
the features that MapPoint
users are familiar with, Maptitude
retains the ease-of-use of the MapPoint
tools while providing functionality
that Microsoft users could only wish
for. Maptitude 2016
supports Microsoft MapPoint-like tools & queries
and dominates the space vacated by MapPoint. With enhanced versions of
the features that MapPoint
users are familiar with, Maptitude
retains the ease-of-use of the MapPoint
tools while providing functionality
that Microsoft users could only wish
for.
The new and improved tools include:
-
Territory management & import:
Create territories on any map layer
from States down to ZIP Codes and
Census Tracts. You can have
overlapping territories, can track
aggregate data such as population,
and can add areas in bulk (e.g. all
the ZIP Codes in a County).
- Route/directions management
& PDF reports: Create and schedule
your routes and waypoints, while
being able to save and load routes
that you have created in any map.
Create attractive PDF strip chart
reports.
Feature equivalent to MapPoint and
supports MapPoint files
 Imports MapPoint PTM files Imports MapPoint PTM files
Unlimited
layers/geocoding/routing
Radius/Drive-time tools
Demographics |
 Routing tools Routing tools
Export to Excel
Territories
More... |
- Hover label tool: Quickly view
customizable information for any map
layer as you hover over the map.
- Drawing tools: Any drawn shape
can be used to create a demographic
report with a simple right click.
New radius and line drawing tools
show distance labels and track the
size of the item drawn.
- Map layers: Metropolitan areas
and 3-digit ZIP Code areas have been
integrated into all tools and maps,
allowing geocoding, thematic
visualization, and territory
creation.
- File formats: Open Microsoft map
files when Maptitude and MapPoint,
Streets & Trips, or AutoRoute are
installed on the same Windows
device.
- Excel export tool: Any of your
areas can be used to create Excel
reports, and these include
multi-location, multi-ring,
drive-time rings and buffers.
 Please
contact the
Maptitude Sales Team
with any questions. View our new
Maptitude 2016 videos
here. Please
contact the
Maptitude Sales Team
with any questions. View our new
Maptitude 2016 videos
here.
|
“So how did my experience of
Maptitude turn out - well it's
fantastic. I have achieved
everything I wanted to be able
to do, and more, regarding
analyzing business data for all
sorts of industries.”
Stephen Kilbee Owner, COVERPOINT.
Read the Case Study here |
|
|
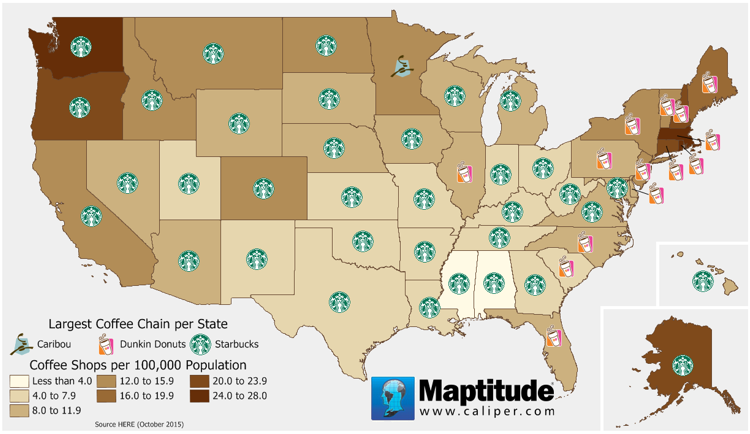
Featured Maptitude Map:
Where the Coffee is Brewing
The 2016 Country
Packages include
an updated point
landmark
database that
includes
thousands of
retail stores
and restaurants,
including coffee
shops in the
United States.
The map below
shows the
concentration of
coffee shops by
state where you
can see that
coffee shops are
more prevalent
in the colder
climate states.
The greatest
concentration
can be found in
Rhode Island,
followed closely
by Massachusetts
(home of Dunkin
Donuts) and
Washington (home
of Starbucks).
The two largest
chains by far
are Starbucks
and Dunkin
Donuts, followed
by Tim Horton's,
Caribou, and The
Coffee Bean &
Tea Leaf. The
chain with the
most stores in
each state is
also shown on
the map.
Starbucks is
predominant in
35 states,
including the
entire western
half of the
country, Dunkin
Donuts is
predominant in
14 states,
mostly in the
Northeast and
South coast, and
Caribou Coffee
is predominant
in its home
state of
Minnesota.

»
See More Featured Maps
|
|
Tech Tip:
How Do I
Schedule My
Waypoint
Arrival,
Duration, and
Departure Times?
 The
new Routing
Manager make it
easy to create
and manage your
routes. Being
able to control
the
characteristics
of the route and
each waypoint,
such as
itinerary and
driving speeds,
is a critical
step in the
planning of your
routes. This was
one of the best
features of
Microsoft
MapPoint and is
new in Maptitude
2016! The
new Routing
Manager make it
easy to create
and manage your
routes. Being
able to control
the
characteristics
of the route and
each waypoint,
such as
itinerary and
driving speeds,
is a critical
step in the
planning of your
routes. This was
one of the best
features of
Microsoft
MapPoint and is
new in Maptitude
2016!
This Tech Tip shows how
you can do this
with Maptitude
2016.
» Learn How Here
|
|
Tricks & Tips:
Excel Reports
for Radius
Drawing Tool

You can quickly
create detailed
reports from
your radius
drawing items,
or from any of
the area
creation drawing
tools. This
was one of the
best features of
Microsoft
MapPoint and has
been improved in Maptitude
2016! Not
only can you
export pushpins
and thematics,
but you will
also get a
detailed
demographic
Excel report for
your market
area.
Once you have
drawn your
shape, lasso, or
radius using the
Drawing Toolbox, you simply
right click on
your drawing
item and choose choose
Export to
Excel. A Microsoft
Excel Workbook
is created that
has a sheet with
a demographic
breakdown, plus
sheets for any
other data that
you have mapped
and that falls
within your
shape.
|
|
|
|
|
|
|
|

