|
Sneak
Preview! Reporting Enhancements in
Maptitude 2015
Maptitude 2015 is due out in the first
quarter of 2015, and we are offering you
an exclusive first look at some of the
new features. Maptitude 2015 provides
the most up-to-date and accurate maps and
demographics available, encompassing
the latest streets, postal codes, business locations, census
data, and more.
Maptitude 2015 improves upon a number of
areas of the software. One of the key
areas Maptitude 2015 focuses on is
significant enhancement of reporting
capabilities. The improvements to the
latest edition of Maptitude will make it
even easier to present and share the
results of your analysis in concise and
informative formats.
Maptitude now supports completely new
ways to share your data including single
click exports to Microsoft Excel,
cutting-edge charts, and PDF reports.
|
Reports
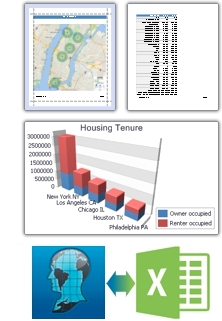
Maptitude 2015 allows you to
use the Drawing Toolbar to
create a shape and then export
data directly to Excel, simply
by right clicking on the map.
With Maptitude 2015, the
reporting tools introduced in
the 2014 version are available
for every analysis tool. The
tools have been redesigned to be
much more intuitive, and to
allow for report
personalization.
Charts
Maptitude 2015 provides a
comprehensive set of over 32
chart types that address a broad
range of business needs with
ease. You can create 2-D and 3-D
charts, and perform
multi-dimensional data analysis
and reporting.
Data Sharing
Maptitude 2015 continues to
support the latest data standards and
file formats with new import
capabilities for Google Maps, Microsoft
MapPoint, and Excel. You can also save to
Microsoft Excel XLSX and create PDF
files for reports and charts.
More to come! There are many
improvements in Maptitude 2015. Stay
tuned for additional information! Please
contact the
Maptitude Sales Team with any questions.
|
 |
|
|
Using Outdated Data & Technology?
Upgrade to Maptitude 2014! |
|
Discounted Upgrades!
Users of Maptitude 2013 and Maptitude
2012 can still get our US$395
reduced upgrade pricing. This
deal
saves you US$300! Upgrade now to avoid
being caught out by using last year's
features and data.
If you upgrade to Maptitude 2014 now,
you can
pre-order your Maptitude 2015 upgrade
for an additional US$195 (for a
total price of US$590.)
New licenses of Maptitude 2014 for
US$695 also qualify to
pre-order Maptitude 2015 for
US$195 (for a total price of
US$890.)
For pricing and ordering information
please visit the
Mapping Software Store, e-mail
Maptitude Sales, or call U.S. Sales
at +1 617-527-4700.
You need the newest maps, the latest
demographics, and the fastest, most
intuitive Maptitude!
  |
If you have any questions,
contact us to check on your
eligibility for this pricing.
Limited Offer: Valid for
Maptitude 2012 or later; Valid
Dec 1, 2014-Feb 28, 2015.
Restrictions
Apply.
|
|
|
Featured Maptitude Map:
Bubble
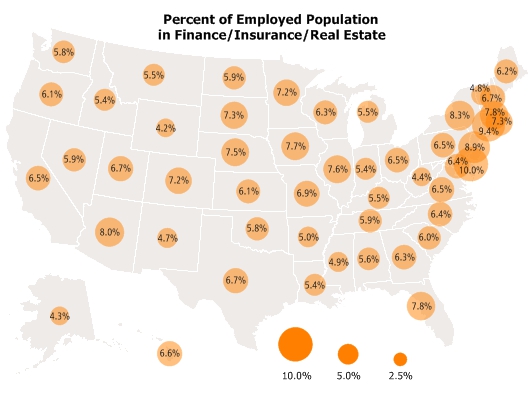
Mapping the FIRE Economy by State (USA)
How does
the FIRE (the Finance, Insurance,
and Real Estate sectors) economy vary
across the US? This map, made with
Maptitude 2014, shows the percentage of
adults working in this field by State.

The map uses thematic mapping in the
form of a scaled-symbol map. The
simplest scaled-symbol is a circle,
or bubble, and the size is proportional to
the associated data.
Bubble maps are easier to understand
than dot density maps, and unlike
heat/color maps they are not restricted
by the size of an area.
As the map illustrates, New York and
surrounding states have the
highest percentages of workers in the
FIRE category, which is also NY City's
largest industry. The FIRE sector is
clearly a prominent part of the service
industry in the overall economy of the
U.S. as well as in other developed
Western countries.
Maptitude includes an extensive database
of demographics at no additional
charge. The demographics include the
variables featured here, along with more
detailed break-downs by industry of
employment and occupation at the ZIP
Code and Tract level. This
local level detail allows for the target
marketing of specific socio-economic
groups.
In the next section we will show how to
create a bubble map. If you
have any questions about data
availability, please
contact Caliper.
»
More Featured Maps
|
"If you're looking for data
visualization and geographic
analysis, Maptitude is your best
bet."
Editor, Vagueware.com |
|
|
Tech Tip:
How Do I
Create a Bubble Map?
 Proportional
symbol maps scale the size of simple
symbols (usually a circle or square)
proportionally to the data value found
at that location. They are a simple
concept to grasp: the larger the symbol,
the "more" of something exists at a
location. The default setting in
Maptitude is to scale the circles
directly proportionate to the data. Proportional
symbol maps scale the size of simple
symbols (usually a circle or square)
proportionally to the data value found
at that location. They are a simple
concept to grasp: the larger the symbol,
the "more" of something exists at a
location. The default setting in
Maptitude is to scale the circles
directly proportionate to the data.
So, for example, if Toronto has twice
the population of Vancouver, the
population symbol for Toronto will
have twice the area. Whether you are
mapping totals, counts,
percentages, rates, or ratios, the scaled
symbol theme will allow to you
effectively map anything from liters of
coffee consumed per capita to the
location and magnitude of earthquakes.
»
Learn How Here
|
|
International:
Updated
Download Free Layers Tool
 Caliper is excited to announce the release of
the updated
Download Free Layers Add-In. Caliper is excited to announce the release of
the updated
Download Free Layers Add-In.
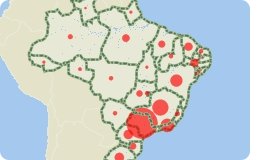
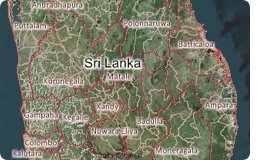
The open source derived data now covers
even more locations including postcodes
for Northern Ireland, and streets and
landmarks for Serbia, Montenegro,
Kosovo, Fiji, Peru, Lebanon, Russia, Sri
Lanka, and Syria.
When boundaries are downloaded using the
tool a basic Country Package is created
that updates the Find and Wizard tools
for your chosen region. The street
layers, while still inappropriate for
accurate routing, now support creation
of drive-time rings and shortest paths
across the chosen region.
»
More Information
|
|
Tricks & Tips:
Creating
Multiple Paths Interactively
 The
shortest path tools in Maptitude identify
the
best paths for deliveries and calculate
the distances between destinations (see
video.) The
shortest path tools in Maptitude identify
the
best paths for deliveries and calculate
the distances between destinations (see
video.)
But, did you know that on the same map you can
create multiple paths each with a
different color? When you are using the
Tools-Routing-Routing
Toolbox "Add a location"
tool, you can simply double click when
adding the final location. Then the next
new location you add is the first stop
of a new path. You can even go back and
use the "Add or remove destination" tool
to manually move locations on any path.
|
|
|
|
|
|
|
|

