In case you missed them, we’ve highlighted the best LinkedIn Maptitude posts from the last month. We delve into current topics in the news and demonstrate how they can be explored with Maptitude. The applications are diverse, ranging from population change analysis, road traffic counts, impact of tourism on retail sales, retail trends, to Canadian suburbanism. Read on to learn how Maptitude mapping software can benefit your organization with map-driven insights and actionable results.

An analysis by Brett
Lucas using #Maptitude
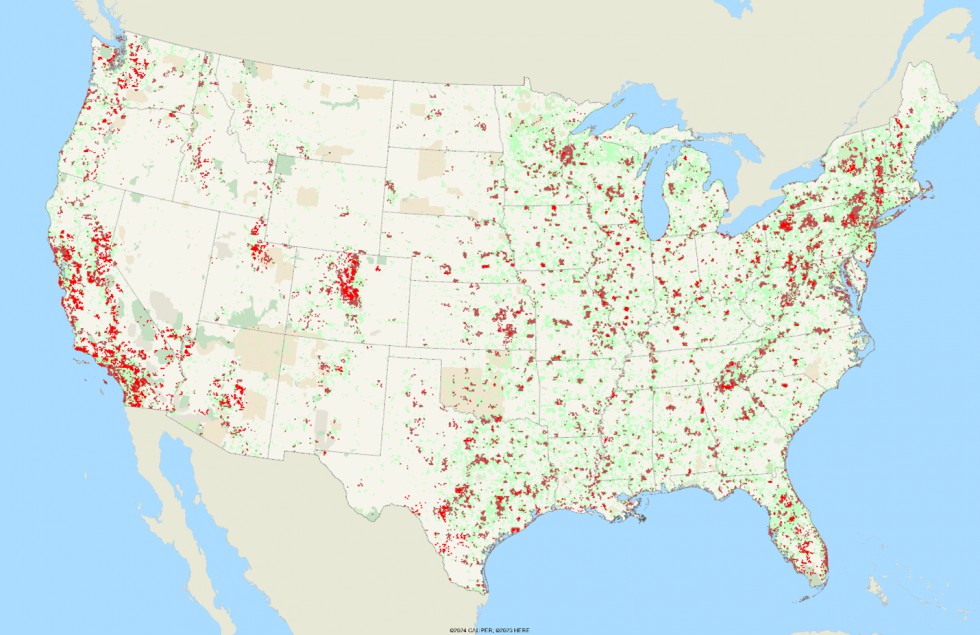
Brett Lucas conducted with Maptitude an analysis of the Population Change between 2010 and 2020 by Census County Division (CCD) or Minor Civil Division (MCD). This analysis provides valuable insights into demographic shifts over the past decade.
The map shows the continuing depopulation of rural America. However, other areas such as Deschutes County, OR, a smaller Metropolitan Statistical Area (MSA), show tremendous growth.
You can explore the population change map and data via Maptitude Online.
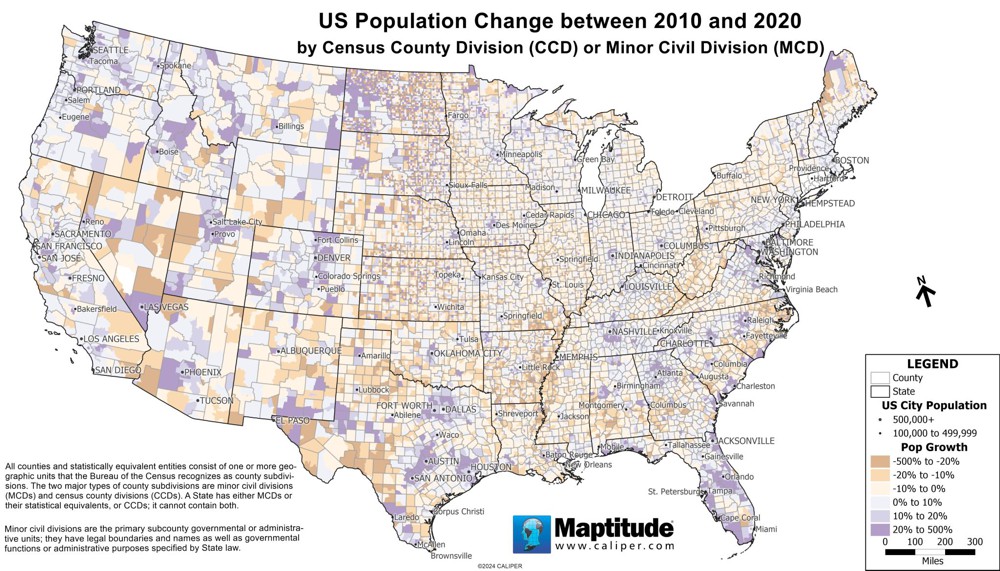
Population Change between 2010 and 2020 by Census County Division (CCD) or Minor Civil Division (MCD). Courtesy of Brett Lucas.
An analysis by Brett
Lucas using #Maptitude
Another analysis by Brett Lucas focuses on the Interstate Highway System and Annual Average Daily Traffic (AADT) counts. Traffic pattern data can be used to perform site analysis. AADT is the total volume of vehicle traffic on a highway or road segment divided by 365 days.
Populous cities like New York, Los Angeles, and Chicago, have some of the busiest highways. For instance, the highest AADT (461,000 vehicles) is for CA-60 just east of Los Angeles. Other routes with crowded highways include I-75 in Atlanta (409,000), I-69 in Houston (341,300), and I-90 in Chicago (327,900).
This data is interesting because it provides a snapshot of the traffic patterns in these major cities. It can be used for various purposes, such as exploring likely traffic at a drive-through, QSR, or brick and mortar store. Moreover, it can help businesses better plan vehicle fleet deliveries, thus optimizing fuel consumption, labor costs, and vehicle utilization, leading to significant savings and improved operational efficiency.
Business-critical data such as the 2020 Census and 2022 American Community Survey (ACS) demographics and boundaries (e.g., ZIP Codes, Tracts, Counties, and States) provide additional context when analyzing AADT, providing valuable insights for business strategy, and more.
You can explore traffic counts with your own data using Maptitude.
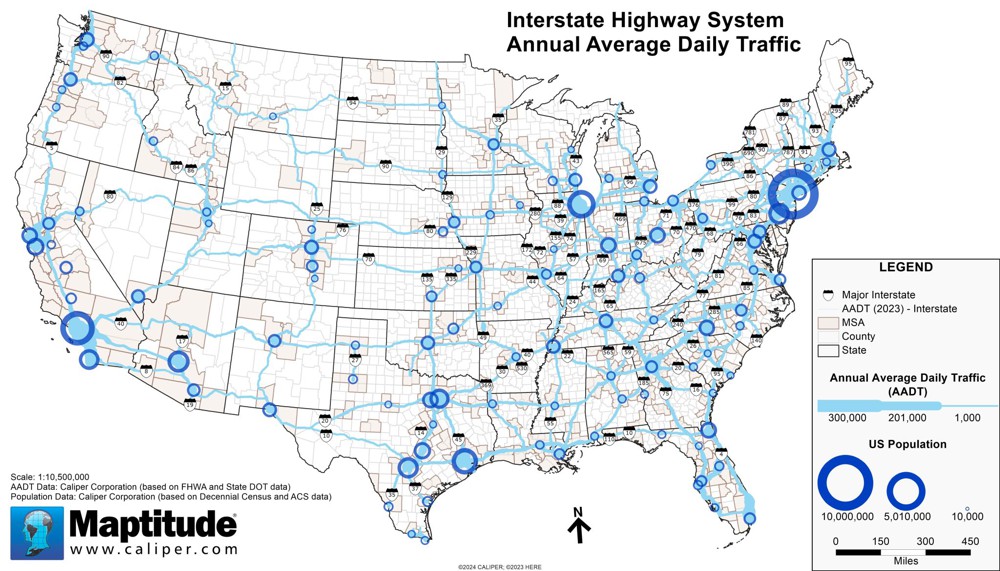
The Interstate Highway System and Annual Average Daily Traffic (AADT) counts. Courtesy of Brett Lucas

An analysis by AGS
using #Maptitude
In “Don’t Call it a Comeback”, AGS delves into the seemingly surprising move by online giant Wayfair to open its first brick-and-mortar store in the Chicago area. It analyzes the strategic pivot of retailers towards catering to today’s shoppers, revealing insightful results.

|
“Overall, this product makes it incredibly simple to visualize and map both customer & company specific data. It is very intuitive and easy to pickup from the get go. I highly suggest utilizing a quick training video or session as it will improve your usability 10 fold with just a few tips & tricks. This product is incredible for what it was built for.”
|
Key Findings:
Maptitude mapping software provides valuable tools for analyzing complex data like the influence of physical retail spaces on shopping trends. By creating maps and visualizations, users can:
New Wayfair location with median household income. Courtesy AGS.
An analysis by AGS
using #Maptitude
In “Summer at the Lake”, AGS used Maptitude to map the often-overlooked impact of tourism on retail sales, particularly in sectors related to convenience goods and food services. AGS analyzed data from a variety of sources, including tourist spending patterns, local demographics, and retail sales figures, revealing insightful results.
Key Findings:
Maptitude mapping software provides valuable tools for analyzing complex data like the influence of tourism on retail sales. By creating maps and visualizations, users can:
Where the summertime temporary population exceeds 1.0% of total residents. Courtesy AGS.

An analysis by Murtaza
Haider using #Maptitude
In “An Ode to Canadian Suburbanism”, Murtaza Haider, a Professor, Columnist, and Data Scientist, offers a fresh perspective on the urban development of Canadian cities and suburbs. He contrasts the realities of European cities with Canadian suburbs, highlighting the underlying issues of racism and inequality in Europe. He points out that Canadian suburbs, built mostly after the 1960s, are vibrant economic and social hubs where immigrants and others are actively forging new narratives of community life. His insights underscore the importance of looking beyond the surface to understand the true nature and potential of urban spaces.
Maptitude mapping software is a valuable tool in such research, allowing you to:
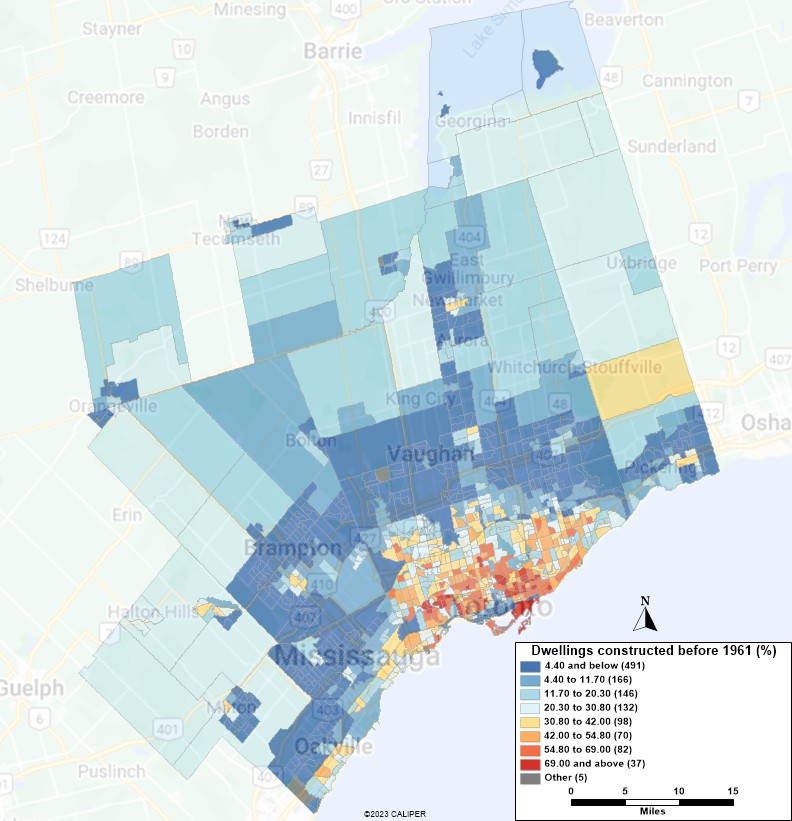
Percent of Toronto dwellings built before 1961. Courtesy Murtaza Haider.
Learn more about Maptitude to see how you and your team can benefit from map-driven insights!
Schedule a Free Personalized Demo
Home | Products | Contact | Secure Store
