|
Upgrade to
Maptitude 2014 for US$395: Last Chance!
For a short time we are extending our US$395
reduced upgrade pricing for
Maptitude 6.0 licenses (also available
for Maptitude 2012 and 2013), including the
USA,
Brazil,
United Kingdom,
Australia, and
Canada Maptitude editions. This deal
saves you US$300!
 If you don't know your version or have
an older license of Maptitude,
contact us to check on your
eligibility for upgrade
pricing! If you don't know your version or have
an older license of Maptitude,
contact us to check on your
eligibility for upgrade
pricing!
Also, each US order will include a free US
ZIP Code update: a US$250 value! The
combination of the offer and free data saves
you US$550!
Maptitude 2014 is a major new release.
Stop using outdated information and get the most detailed
and accurate
data and demographics ever included.
For pricing and ordering information
please visit the
Mapping Software Store, e-mail
Maptitude Sales, or call U.S. Sales
at +1 617-527-4700.
Limited Offer: Valid until June 30, 2014.
Valid for Maptitude 6.0 or later.
Restrictions Apply.
You need the newest maps, the latest
demographics, and the fastest, most
intuitive Maptitude!
  |
| |
Featured Maptitude Maps:
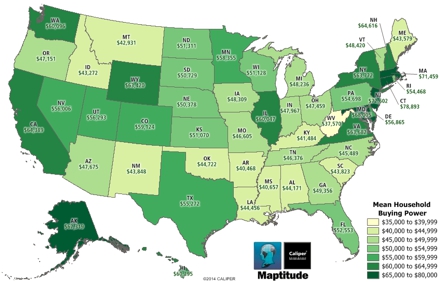
Per Household
Disposable Income
(By U.S. State)
This map, made with Maptitude 2014,
showcases per household disposable
income by US
state. This statistic describes the
amount of money remaining after the
payment of taxes. Being able to identify
those areas with money to spend is
a powerful marketing tool with
implications for customer identification
and revenue generation. In the
Maptitude USA Country Package these data
are available down to the Census Tract
and ZIP Code level.
|
"Maptitude 2014 includes Census, ACS, and FFIEC
income data that saves us many hours of searching,
selecting, downloading, sorting and combining data."
Mike Meuser, Owner, MapCruzin
|
Maptitude and Income: Where are the
spenders?
Affluent consumers are prized marketing
prospects. Accordingly, marketers from
retail to restaurants to financial
services fiercely compete for these
consumers.
Maps help you visualize the demographic
and geographic attributes that can be
used to analyze these populations,
enabling a deeper understanding of where
they live and how they can be reached.
Maptitude 2014 allows
you to map variation in wealth and related
statistics such as
median or mean income, population by
income bracket by race, disposable
income by gender, education, and home
value. These figures
can also be compared to population density, age
distribution, family size, and
more.
The Maptitude
2014 USA Country Package includes
extensive demographics including projections for 2015 and 2020 (more...).
Upgrade to Maptitude 2014 now to access
the latest income information.
More Featured Maps...
If you would like to see your maps showcased here,
or are interested in
custom map making services and
software please
contact
Caliper.
Focus on Maptitude:
3-D
Mapping Software
Maptitude is designed to meet the
specific challenges and requirements of
organizations that map, design, plan,
build, and operate our global
infrastructure.
Maptitude costs only US$695 and is
packaged as a one-stop-solution,
shipping with all the tools required to
allow infrastructure professionals
(analysts, surveyors, architects,
planners, civil engineers, geoscientists
and designers) to model 3D data.
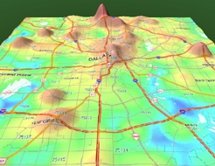 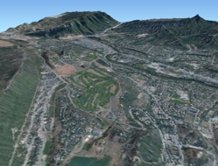
With Maptitude, you can:
√
Use your 2D GIS datasets to create and
manipulate 3D views
√
"Exaggerate" the vertical differences in
elevation and models
√
Create, utilize, analyze, visualize,
manage, and edit 2D/3D spatial data with
GIS and CAD Tools
√
Share 3D flythrough videos
√
View and manipulate aerial/satellite
image layers
√
Perform reprojections and
coordinate/projection/datum
transformations, and manipulate
geometries
√
Create reports and publish
high-resolution maps as graphics or as
large-scale prints
√
Work with parcel and cadastral layers
3D Views can be comprised of:
√
Surface layers that are based on a map
or aerial/satellite image draped over a
3D surface
√
Grid layers such as a Digital Elevation
Model (DEM)
√
Extruded building footprints, which are
a simple way to represent buildings as
3D blocks
√
Models such as vehicles, people,
vegetation, buildings, bridges, and any
other structure
|
What Others Have to Say: |
 Dr.
Aniruddha Banerjee Dr.
Aniruddha Banerjee
IUPUI; UC Berkeley
"The
new Maptitude 2014 GIS provides
a sophisticated 3-D reality that
looks professional as well as
providing viewers with artistic
and precise 3-D maps." |
|
|
Free Mapping Resources:
Free Beta Analysis Tools!
This month's free resource is a
collection of powerful mapping
tools. These five new add-ins
are in beta and support:
•
Nearest
locations calculations
•
Optimal site locations
•
Flow diagrams
•
Selection set exports
•
Batch output of
map images

»
Free Mapping Software Tools
»
More Free Mapping Software
Resources...
|
Maptitude 2014 Training:
Limited Availability
 New
topics cover Maptitude 2014!
Advance
registration for the instructor-led training courses is required.
Upcoming classes: New
topics cover Maptitude 2014!
Advance
registration for the instructor-led training courses is required.
Upcoming classes:
•
Oct. 20-22: Boston MA
Space is limited, so
register online as soon as possible.
If you have any questions, please call Maptitude
Training (USA) at +1 617-527-4700, or send
an e-mail to
sales@caliper.com.
|
Maptitude International News:
Canada,
Brazil, & Mexico
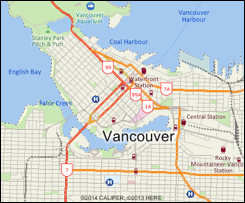
2014 Country Packages Released
Caliper is excited to announce the
2014 Country
Packages for Canada, Brazil, and Mexico! The products include a wealth of data and
functionality not available in any other software. Both the Canada
and Brazil Packages now include full postcode visualization
and pin-mapping (geocoding)! The Canada Package includes
over 900 demographics fields for 2011, including earnings
and income data.
The data include up-to-date
postal layers and street layers with
address data for geocoding and
travel time calculations. Also included are updated
building footprints for many
urban locations, railroads, and
comprehensive named landmarks
that range from public
facilities to commercial
buildings including shops,
restaurants, and retail stores.
|
|
Did You Know?
Creating
Formula Fields Without Opening a
Dataview
Formula fields in Maptitude
support calculations that derive
their value from other fields,
expressions, or values. Formulas
can help you automatically
calculate the value of a field
based on other fields. These can
include sales penetration rates,
for example, using your data
plus the Maptitude demographics.

Maptitude makes it easy to create a
formula field even if the
working window is not a
Dataview. You
simply choose
Dataview-Formula Fields
and create your new calculation.
Formulas can contain field
names, arithmetic-, relational-,
and logical- operators, plus
many different types of numeric
and string functions.
|
Maptitude
News and Press:
• 2014
Block Groups Released!
•
WBAI-FM, Martin Winston,
9th April 2014
•
Detroit Area CRA Small
Business Lending
•
More Maptitude News...
Maptitude
Solutions:
Banking GIS
Business Mapping
Census Data Mapping
Community Development
Election Management
Enterprise GIS
Franchise Mapping
GIS Software
GPS Mapping
Insurance Mapping
Law Enforcement GIS
Location Intelligence
Marketing & Sales Mapping Software
Public Health Mapping
Real Estate Mapping
Redistricting
Route Planning & Deliveries
Satellite & Aerial Imagery
Street Mapping
Territory Mapping
Web Mapping
World Mapping
|
|
Tech Tip:
Create
Custom Fields Such As Per Household
Disposable Income Using Formula Fields
Maptitude
implements a professional-strength
relational database, a feature critical
for GIS software. Attribute data may be
freely joined to and detached from
geographic layers and tables. Relational
data manipulation is integrated with
robust and powerful geoprocessing for
spatial queries, polygon overlay, and
other location-based analyses. This is
supported seamlessly so that data are
moved easily to and from relational
tables and geographic databases. In
addition, the Maptitude fixed-format
binary table supports 32,767 fields and
1 billion records, and has unlimited
character field widths. Table field
tools include the ability to hide, show,
filter, lock, format, multi-field sort,
create live expression/formula fields,
and perform multi-cell fills.
Maptitude includes
extensive demographics. These
data, such as Caliper's proprietary
purchasing power estimates, are among
the most accurate available from any
source and are significantly more reliable
than U.S. Census data. Formula fields
allow you to analyze the included data
and to integrate it with your own
information.
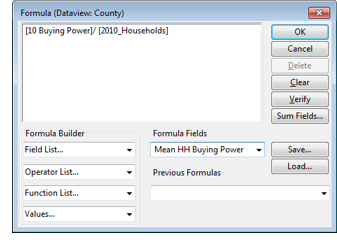 The
following steps illustrate how to create and map a per
household disposable income field on the
U.S. County layer: The
following steps illustrate how to create and map a per
household disposable income field on the
U.S. County layer:
-
Choose File-New and use
Create-a-Map Wizard to create a general purpose map
for a state of interest.
-
If the County layer is not visible, use the Display
Manager to make it visible and make it the working
layer.
-
Choose Map-Color Theme or
click
 . .
-
Choose Formula... from the bottom
of the Field drop-down list.
-
Using the Formula Builder
drop-down lists, create the formula [10 Buying
Power] / [2010_Households].
-
In the Formula Fields drop-down, type Mean
HH Buying Power.
-
Click OK to close Formula dialog box and click OK
again in the Color Theme dialog box. Maptitude
creates a theme of the mean household buying power
by county.
To insert your results into a presentation you can
choose File-Save As to
export your map for use outside of Maptitude.
|

