|
Upgrade to
Maptitude 2014 for US$395: Last Chance!
Until June 30th we are extending our US$395
reduced upgrade pricing for
Maptitude 6.0 licenses (also available
for Maptitude 2012 and 2013), including the
USA,
Brazil,
United Kingdom,
Australia, and
Canada Maptitude editions. This deal
saves you US$300!
 If you don't know your version or have
an older license of Maptitude,
contact us to check on your
eligibility for upgrade
pricing! If you don't know your version or have
an older license of Maptitude,
contact us to check on your
eligibility for upgrade
pricing!
Also, each US order will include a free US
ZIP Code update: a US$250 value! The
combination of the offer and free data saves
you US$550!
Maptitude 2014 is a major new release.
Stop using outdated information and get the most detailed
and accurate
data and demographics ever included.
For pricing and ordering information
please visit the
Mapping Software Store, e-mail
Maptitude Sales, or call U.S. Sales
at +1 617-527-4700.
Limited Offer: Valid until June 30, 2014.
Valid for Maptitude 6.0 or later.
Restrictions Apply.
NEW WAYS TO VIEW & SHARE MAPS!
SIGNIFICANT DATA UPDATE!
  |
| |
Featured Maptitude Maps:
Is Your State Old Or Young?
(USA)
This map, made with Maptitude 2014,
showcases median age by US
state. This statistic is the age
separating the older half of the
population from the younger half. States
with a higher median age than the
national average are shown in green and
states with a lower median age are shown
in pink.

Being able to identify
areas by generation (people sharing an
age range) is
a powerful marketing tool that provides
you with a focused and efficient way of
reaching your ideal target audience. In the
Maptitude USA Country Package these data
are available down to the Census Tract
and ZIP Code level.
Analyzing age is the most proven
demographic marketing method that you
can use to get your product into the
hands of those who will want it. Along
with gender, income and education, using
age helps identify life stage and even
lifestyle grouping.
Maps help you clearly visualize age
distributions and can be
used to analyze target populations and
geographies,
enabling a deeper understanding of where
people live and how they can be
contacted.
Maptitude 2014 allows
you to map variation in age and related
statistics such as
median or mean income, income bracket, disposable
income by gender, education, and home
value. These figures
can also be compared to population density, age
distribution, family size, race, and
more.
The Maptitude
2014 USA Country Package includes
extensive demographics including projections for 2015 and 2020 (more...).
Upgrade to Maptitude 2014 now to access
the latest income information.
More Featured Maps...
If you would like to see your maps showcased here,
or are interested in
custom map making services and
software please
contact
Caliper.
Focus on Maptitude:
You need accurate
and current data to make informed decisions
Maptitude 2014 includes an extensive
catalog of business and demographic data
that lets you analyze and find the best
opportunities for your organization.
Maptitude 2014 costs only US$695 and is
packaged as a one-stop-solution,
shipping with all the data you need to
understand the variety of social,
geographic, and economic indicators that
can impact your business.
With Maptitude 2014 and the tremendous
amount of included nationwide
geographic, Census, and demographic data, you can:
√ Start mapping
as soon as you install the software
√
Analyze markets and uncover information
about the population that can be used in
your business research efforts
√
Evaluate competitors
√
Identify opportunities
√
Profile customers
√
Perform business research and planning
initiatives
√
Integrate multiple data formats
including tables,
spreadsheets, and geographic databases
√
Find specific industry information to
help you create a business plan, refine
your marketing strategy and manage your
company
The
categories of data provided with
Maptitude include:
 √
Income √
Income
√
Population
√
Business & Employment
√
Housing
√
International
√
Banking
|
What Others Have to Say: |
 Brenden
Morley Brenden
Morley
Hillman Group, Tempe, AZ, USA
"The
data is accurate and very
visually appealing. What this
will mean in understanding the
world around me is enormous. I
have been able to jump right in
and make beautiful, meaningful
and accurate maps. Having the
power to analytically divide
markets, populations etc., will
result in decisions with
pinpoint accuracy." |
|
Maptitude 2014 Training:
Limited Availability
 New
topics cover Maptitude 2014!
Advance
registration for the instructor-led training courses is required.
Upcoming classes: New
topics cover Maptitude 2014!
Advance
registration for the instructor-led training courses is required.
Upcoming classes:
•
Oct. 20-22: Boston MA
Space is limited, so
register online as soon as possible.
If you have any questions, please call Maptitude
Training (USA) at +1 617-527-4700, or send
an e-mail to
sales@caliper.com.
|
Maptitude International News:
Beta Menu
Translation Tool: Spanish
Maptitude
includes the Geographic Information System Developer's Kit (GISDK™).
Over 700 functions can be called from Caliper Script, a complete
programming language for designing menus and dialog boxes (including
toolbars and toolboxes) and for writing macros. You can develop
add-ins that extend the standard interface to provide new
capabilities or that automate repeated operations.
There are several such
free mapping tools, here.
You can download any of the
add-ins to extend the
capabilities of Maptitude. This
month we have released a new
add-in that translates the
Maptitude menu items (not dialog
boxes, tools-tips, or messages)
into Spanish. This
beta translation tool is
available here.

|
|
Did You Know?
Improve
Map Quality to Over 300 DPI
Maptitude makes it easy to create
map graphics for use in other
applications such as Microsoft
PowerPoint and Word. Maptitude
supports a wide variety of
export formats that include
both vector and raster image
file types.

Maptitude 2014 runs as a 32-bit
or 64-bit application on 32-bit
or 64-bit Windows 8, 8.1, 7,
Vista or XP. One of the many
advantages of a 64-bit Maptitude
includes the ability to save to
much higher resolution images.
For maps you can choose File-Save
As and for Bitmap,
JPEG, PNG, GIF, and TIFF files
you can click Options.
This allows you to change the
resolution (dots per map window
inch). The maximum resolution is
set as 300 DPI, but you can
manually override this by typing
in your preferred level of
detail.
|
Maptitude
News and Press:
• Caliper
releases Maptitude 2014
•
2014 Canada Country
Package!
•
Maptitude Census Block
Groups Data &
Demographics Updated!
•
More Maptitude News...
Maptitude
Solutions:
Banking GIS
Business Mapping
Census Data Mapping
Community Development
Enterprise GIS
Franchise Mapping
GIS Software
GPS Mapping
Insurance Mapping
Law Enforcement GIS
Location Intelligence
Marketing & Sales Mapping Software
Public Health Mapping
Real Estate Mapping
Route Planning & Deliveries
Satellite & Aerial Imagery
Street Mapping
Territory Mapping
World Mapping
|
|
Tech Tip:
Create
Custom Fields Such As Millennials Using
Sum Fields
Maptitude
provides many age-based demographics
including total population, current and
future age group numbers, and age
brackets broken down by education,
gender, birthrate, health insurance
coverage, poverty status,
and more.
These data are critical to those
organizations that target their services
to particular cohorts, or to those
businesses that supply products aimed at
a particular segment of the population.
For example, if targeting products
towards the Latin American
population in the USA, then language spoken by
age would be an invaluable
differentiator and one that Maptitude
supplies.
The age-based data provided with
Maptitude are often segmented into
ranges (e.g. under 18, or 35-39). Formula fields
allow you to combine these populations
into the target groups that you need to
reach.
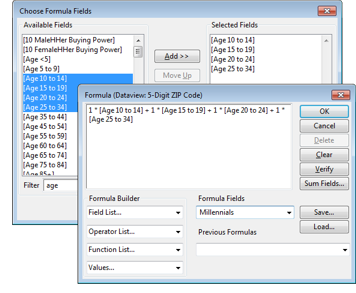
 The
following steps illustrate how to identify and map
Millennials, defined here as those born
between 1980 and 2004: The
following steps illustrate how to identify and map
Millennials, defined here as those born
between 1980 and 2004:
-
Choose File-New and use
Create-a-Map Wizard to create a general purpose map
for your area of interest.
-
If the ZIP Code layer is not visible, use the Display
Manager to make it visible and make it the working
layer.
-
Choose Map-Color Theme or
click
 . .
-
Choose Formula from the bottom
of the Field drop-down list.
-
Click Sum Fields. In the
Filter box type age.
Highlight the four fields covering the ages from 10
to 34 years old, and click Add>>.
-
Click OK to close the Choose
Formula Fields dialog box and click OK
again in the Sum Fields dialog box.
-
In the Formula Fields drop-down, type
Millennials.
-
Click OK to close the Formula dialog box and click
OK
again in the Color Theme dialog box. Maptitude
creates a theme of the Millennial population by ZIP
Code.
To insert your results into a presentation you can
choose File-Save As to
export your map for use outside of Maptitude.
|

