 |
| October 2012 |
|
|
Learn how Maptitude can help your organization: Marketing & Sales Mapping Software
Caliper continues to offer new country packages for use with Maptitude, including:
|
|
|||||||||||||||||||||
Featured Data
Product: New!
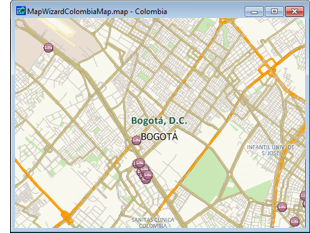
Package for Colombia New!
Package for Colombia
Do you have global customers or assets in multiple countries? If so, the new Maptitude Country Packages will allow you to quickly and easily support your international mapping requirements. Each Package includes access to an up-to-date NAVTEQ® database, allowing accurate address locating and street visualization, plus robust data on which to calculate driving routes and travel time rings. Also included from NAVTEQ® are building footprints for many urban locations, railroads, and comprehensive named landmarks that range from public facilities to commercial buildings including shops, restaurants, and retail stores. Also shipped are postal data and, where available, detailed demographics. Each Package covers a single country. Maptitude ships with one Package of your choice, and additional countries can be purchased separately. Upgrades are available. Visit the Colombia Country Package page here: ../international/colombia.htm. Price: US$695. Place your order online at the Caliper Store Now. |
||||||||||||||||||||||
|
Tech Tip:
Order of Chart Themes
Thematic maps illustrate the characteristics of map features, so that the data are easy to see and understand. A map theme is a styling of map features according to the values of one or more data fields (see the training video). In Maptitude, chart themes are drawn in the natural order of fields in a Dataview. Creating a chart theme from the map does not allow you to change this order. Creating a chart theme from a Dataview, however, does allow you to create chart themes with bars in any order. The following steps walk you through this task: 1. Open a Dataview of the layer for which you are working by right clicking on the layer in the Display Manager and choosing New Dataview. 2. While holding down the shift- key, click on column headings in the order you want them displayed in the map. The columns will become highlighted as you click on them. 3. Click on the Chart Theme button on the Standard Toolbar. Maptitude computes the theme for the chosen fields. 4. A new map window is displayed. You will see pie charts, which are the default chart theme type. 5. To change to bar charts, click on the Chart Theme button on the Main Toolbar, and choose a type of bar chart. 6. Click OK, and the map will draw with bar charts, the bars being in your chosen order. To use the theme in another map, make the layer the working layer in the other map, click the Chart Theme button on the Standard Toolbar, and click Load. Maptitude displays the Load Area Chart Theme dialog box. Click the From Workspace radio button, choose the chart theme to copy, and click OK twice to close both dialog boxes. |
||||||||||||||||||||||
|
Featured Maptitude Maps:
"Blood Tests Link Agent Orange To Fort Detrick Cancers" This month we showcase maps created by the Kristen Renee Foundation in a report documented by WUSA9 News: "Blood Tests Link Agent Orange To Fort Detrick Cancers". The Maptitude GIS Software is used to investigate a possible cancer cluster around Fort Detrick.
|