|
August 2016 Newsletter |
View in Browser |
||
|
|||
Website | Contact Us | Pricing | Live Demo | Reviews
Free Map Resources
PDF Maps, Healthcare Data, Add-Ins

|
|
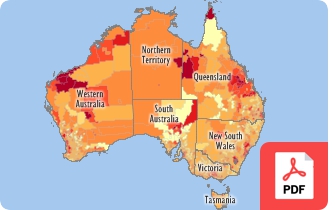
The free map resources section of our website provides access to PDF maps for locations all over the world, as well as several free datasets, and a suite of add-in tools. New this month are a series of free postcode maps for Australia. These maps are provided in PDF format and show population and postal geography for the states and major cities of Australia. One of the most popular downloads is USA healthcare locations by taxonomy code. You can download the five free healthcare layers here. These map layers include the taxonomy codes and descriptions for each location. The free GIS tools add functionality such as finding nearby locations, batch/multiple map image output, and a country data downloader. |
Learning
Free MapPoint Webinar, Video, & Handout Now Available! September Training Dates!

|
|
MapPoint Webinar: This webinar will help MapPoint users new to Maptitude 2016. We will discuss mapping your data, changing the styles on a map, getting reports on custom-defined areas, creating drive time rings, the hover label tool and creating territories. There is also a free class handout here. September training: Access experienced Maptitude trainers in a classroom setting. |
Featured Map
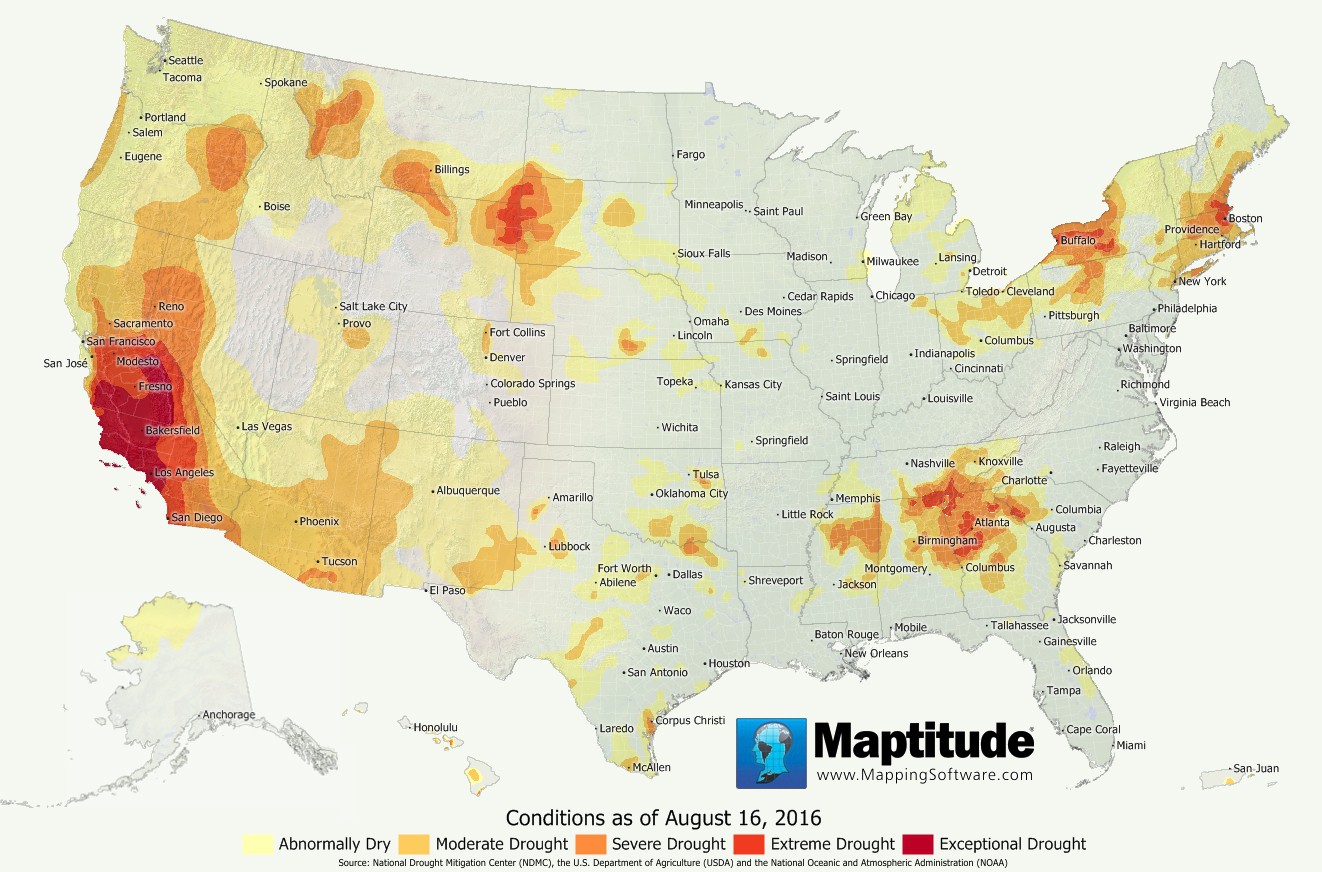
U.S. Drought Conditions as of August 2016
Despite the recent heavy flooding in Louisiana, much of the United States remains quite dry with abnormally dry conditions now covering 40% of the land area in the United States as of this month. You can download drought layers to use in your Maptitude maps (available in KMZ and SHP formats) from the United States Drought Monitor GIS Data Archive page. Data are available in weekly intervals going back to 2000.

Tech Tip
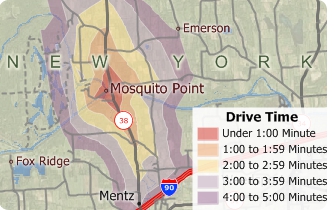
How do I create drive-time rings under 5 minutes?

|
|
Maptitude allows you to create drive-time rings/zones for intervals smaller than 5 minutes and greater than 240 minutes. This Tech Tip shows how you can do this with Maptitude 2016. |
Tricks & Tips
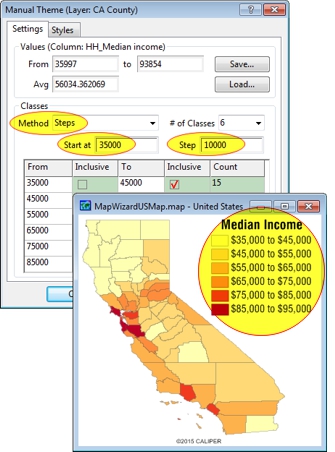
Customizing Heat Map Ranges

|
|
The Color Theme Wizard automatically classifies your data into the number of classes that you want and by default minimizes within-group variance. It is very easy to customize these ranges by choosing Map-Color Theme and clicking the Customize button. If you want all of your classes to be size intervals, choose the Steps method, enter a value for the lowest class, enter a step interval, and click OK. Maptitude redraws the map using the values you chose. |

