|
Maptitude:
Energy Market Mapping Software
Maptitude is a robust and
easy-to-use professional mapping tool
that can be used within the energy
industry. Maptitude
provides all the features that your
organization requires in order to
uncover answers to your energy market
questions.
The extensive capabilities of Maptitude
allow you to geographically understand
and analyze relationships among the
varied energy sectors.
Maptitude costs only $695.00 USD and is
packaged as a one-stop solution. It
ships with all the tools and data
required by energy analysts and
policymakers for site assessment, data
sharing, and visualization.
Site Assessment
Maptitude is an indispensable tool for
site assessment and environmental impact
studies. For example, Maptitude can
assist in locating nuclear reactors by
identifying sites away from areas of
high population density and man-made
hazards, while overlaying seismic,
meteorological, geological, and
hydrological map layers.
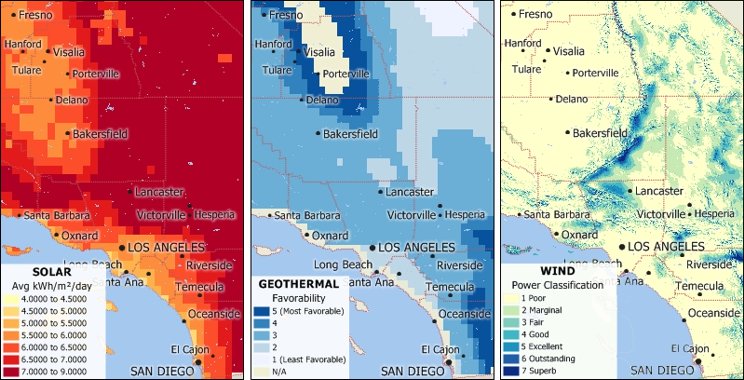
Renewable energy systems are
vulnerable to weather and climatic
conditions, but combining renewable
energy sources into a hybrid system such
as solar-wind helps mitigate these
dependencies. Maptitude is well suited
to mapping locations with favorable
energy potential, and for geographically
exploring related environmental and
economic considerations.
For example, Maptitude can map
topography and proximity to electric
transmission lines when exploring
locations for a wind farm.
»Story
Continued Here
See how Maptitude can benefit your
industry
here, or contact
sales@caliper.com for more
information.
|
"Maptitude has been an important
tool for showing the geography
of a variety of facilities and
parameters, from rig trends by
state, to patent trends by metro
area, to the location of
important infrastructure
installations both onshore US
and Gulf of Mexico. Being able to
illustrate and map these
elements with Maptitude was
essential for the analysis and,
in addition, the software is
backed up with outstanding
support if needed."
 Charlotte
Batson, Petroleum
Engineer / Shale Oil & Gas
Consultant Charlotte
Batson, Petroleum
Engineer / Shale Oil & Gas
Consultant
|
|
|
25% Off US Census Block Data &
Demographics |
|
Detailed Census Data Sale!
 Purchase
the
US Census Blocks for only US$600 ($795 value) for the
rest of this month. These
boundaries are the highest
resolution available for the
mapping of Census demographics,
describing on average only 28
people. Purchase
the
US Census Blocks for only US$600 ($795 value) for the
rest of this month. These
boundaries are the highest
resolution available for the
mapping of Census demographics,
describing on average only 28
people.
If you have any questions,
contact us to check on your
eligibility for this pricing.
Limited Offer: Valid until
October 31, 2014.
Restrictions
Apply.
|
|
|
Featured Maptitude Map:
Oil Pipelines
in the USA
This map, made with Maptitude 2014,
shows the major crude oil and petroleum
pipelines in the United States. Also
shown is the proposed route for
the controversial Keystone XL (KXL)
project.
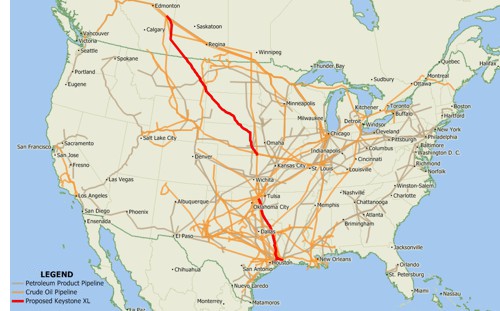
The construction of the Keystone
Pipeline would run from Alberta,
(Canada) to Texas (USA) refineries along
the gulf coast. It adds a number of
miles of pipeline, although it will also
use existing pipelines.
There are thousands of miles of
pipelines around the United States, and
building a pipeline is not unusual.
However, environmental, political, and
economic issues have prevented the KXL
project from being implemented. One of
the main issues is that the pipeline
will transport tar sands oil, the
extraction and production of which is
widely viewed as emitting three times
more carbon dioxide than does the
extraction and production of
conventional oil.
Maptitude supports layered maps,
allowing almost any external map data to
be quickly and easily displayed and
analyzed such as the pipeline data shown
here. Maptitude supports over 50 file
types and more than 100 GIS and CAD
formats. This
extensive library of importers and
exporters is one of the largest in
the industry and comes at no additional
charge.
Contact Caliper to see how using your
own, and publicly available, data with the Maptitude
2014 USA Country Package allows you
to create the maps that tell the story
your spreadsheets can't.
»
More Featured Maps
|
"Maptitude has lots and lots of
formats to import from or export
to."
Pieters De Kock, Consultant, South Africa |
|
|
Tech Tip:
How Do I
Add Layers to a Map From Energy Market
Websites?
 When conducting
an analysis such as energy market research
or when siting new power plants or
industrial facilities, it is
critical to understand the geographic
context of your assets. Maptitude
makes it easy to geographically evaluate
the risks and opportunities in today's
energy markets.
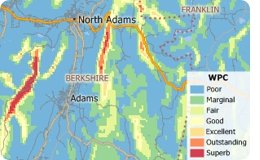
For example, you
may want to explore wind potential when
choosing sites for wind turbines. When conducting
an analysis such as energy market research
or when siting new power plants or
industrial facilities, it is
critical to understand the geographic
context of your assets. Maptitude
makes it easy to geographically evaluate
the risks and opportunities in today's
energy markets.
For example, you
may want to explore wind potential when
choosing sites for wind turbines.
There are many sources of data for
energy markets including the
U.S. Energy Information
Administration (EIA). This exercise will
walk you through downloading and mapping
the National Renewable Energy Laboratory
(NREL) map layer for onshore 50 meter
tower wind potential.
»
Learn How Here |
|
International:
2014
Russia Country Package Released
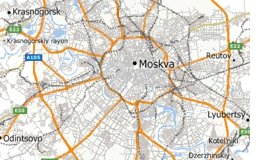 Caliper is excited to announce the release of the 2014 Country
Package for Russia. The product
includes the latest map updates for
streets, railroads, postal and administrative
boundaries, and towns, as well as comprehensive
named landmarks that range from public
facilities to commercial buildings
including shops, restaurants, and retail
stores! Caliper is excited to announce the release of the 2014 Country
Package for Russia. The product
includes the latest map updates for
streets, railroads, postal and administrative
boundaries, and towns, as well as comprehensive
named landmarks that range from public
facilities to commercial buildings
including shops, restaurants, and retail
stores!
»
More Information
|
|
Tricks & Tips:
Map Layer
Precedence
 A
critical feature in a powerful and
flexible mapping application is the
ability for the user to change and
control map layers. A map is a series of
sheets that are layered on top of each
other, with each sheet containing
different information such as geographic
"areas" for coal fields or "points" for
power plants. Because each layer can
have varying levels of transparency, the
drawing order is generally such that
areas draw first, then lines, then
points, so that as many map features as
possible are visible. A
critical feature in a powerful and
flexible mapping application is the
ability for the user to change and
control map layers. A map is a series of
sheets that are layered on top of each
other, with each sheet containing
different information such as geographic
"areas" for coal fields or "points" for
power plants. Because each layer can
have varying levels of transparency, the
drawing order is generally such that
areas draw first, then lines, then
points, so that as many map features as
possible are visible.
The Map-Layers
tool allows you to move layers up and
down, while map redrawing can be paused
by clicking the Esc key on your
keyboard.
|
|
|
|
|
|
|
|

