If you need a custom map for your story, blog, or website, contact us because we offer a limited number of free custom maps on a first-come, first-served basis! See our Featured Maps for inspiration.
Maptitude is the best mapping software for business intelligence! Maptitude allows you to map locations in almost any industry. Maptitude Country Packages include a landmark layer with the locations of businesses and free datasets are also available to current Maptitude users.
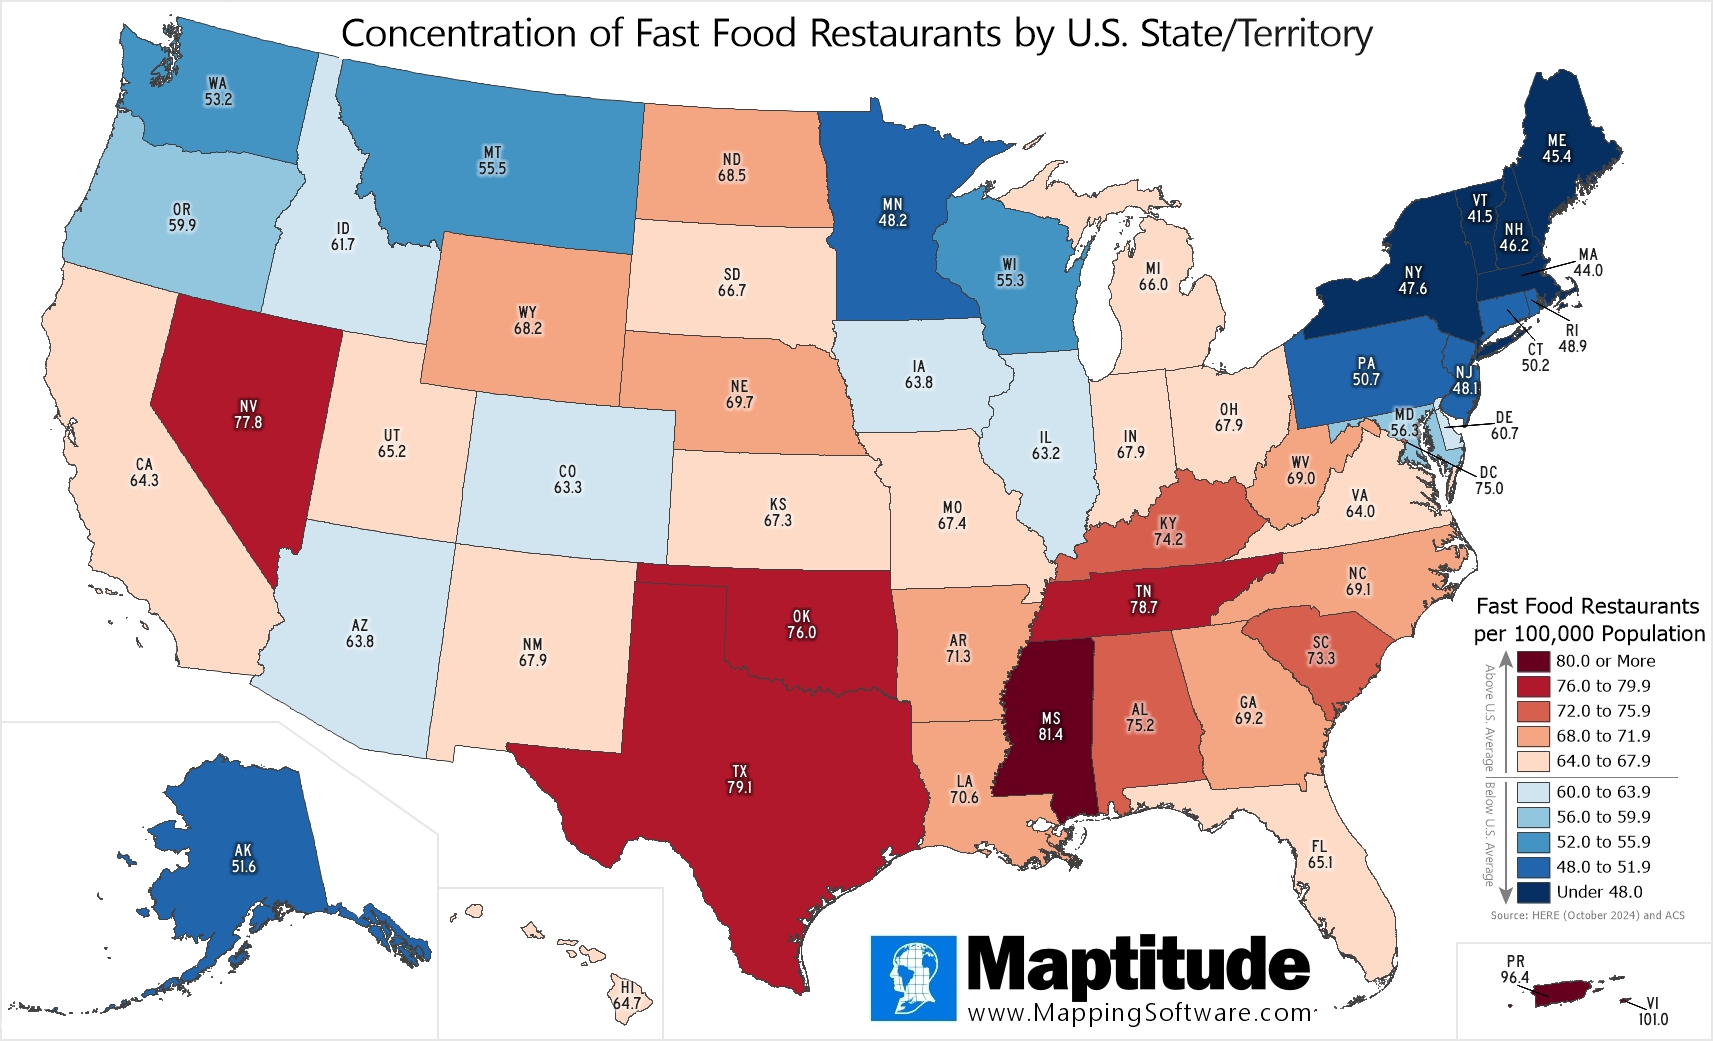
For National Fast Food Day (November 16) we mapped almost 215,000 fast food restaurants nationwide and computed the number of stores per 100,000 people in each state and territory. The national average is 64 per 100,000. States above the national average are shown in shades of red with the highest concentration found in the Virgin Islands (101.0), Puerto Rico (96.4), and Mississippi (81.4). States below the national average are shown in blue with the lowest concentration found in Vermont (41.5), Massachusetts (44.0), and Maine (45.4).

Map: Created with Maptitude Mapping Software by
Caliper, November 2024
Sources: HERE (October 2024) and Census
American Community Survey
#Maptitude #NationalFastFoodDay #FastFoodMap #November16 #FastFood

Home | Products | Contact | Secure Store