| Mapping, GIS, & Transportation Software Solutions |
| Mapping, GIS, & Transportation Software Solutions |
Caliper offers income and purchasing power data that have been compiled from the Census, the American Community Survey, and other sources with additional estimates and methodology provided by Caliper. A complete list of the available income and purchasing power data fields is below.
Income data are available at the following geographic levels: States*, Counties*, MSAs*, Census Tracts*, Census Block Groups*, ZIP Codes*, Congressional Districts.
The data are available in Caliper data formats and other file formats. To learn more or to order, please contact a Caliper data expert today by emailing sales@caliper.com or by calling us at +1 617-527-4700.
Household Income
Median Household
Income
Number of Households with Income <$10,000
Number of
Households with Income $10,000-14,999
Number of Households with
Income $15,000-24,999
Number of Households with Income $25,000-34,999
Number of Households with Income $35,000-49,999
Number of Households
with Income $50,000-74,999
Number of Households with Income
$75,000-99,999
Number of Households with Income $100,000-149,999
Number of Households with Income $150,000-199,999
Number of
Households with Income $200,000+
Median Household Income: White¹
Median Household Income: Black¹
Median Household Income: Am Indian¹
Median Household Income: Asian¹
Median Household Income: Hawaiian¹
Median
Household Income: Other¹
Median Household
Income: 2+ Races¹
Median Household Income: Non-Hisp White¹
Median Household Income: Hispanic¹
Households w/earnings
Households w/earnings: Mean earnings
Households w/Social Security income
Households w/Social Security income: Mean income
Households w/retirement Income
Households
w/retirement Income: Mean income
Households w/Supplemental Security Income
Households w/Supplemental Security Income: Mean income
Households w/public assistance income
Households w/Public Assistance Income: Mean income
Households
W/Food Stamp/SNAP benefits†
Earnings
Median earnings for workers
Median earnings Male full-time¹
Median earnings Female full-time¹
Disposable
Income/Purchasing Power
Total aggregate buying power²
Aggregate male householder buying power²
Aggregate female householder
buying power²
Aggregate Income
by Race
Aggregate Income: White¹
Aggregate Income: Black¹
Aggregate Income: Am Indian¹
Aggregate Income: Asian¹
Aggregate Income: Hawaiian¹
Aggregate Income: Other¹
Aggregate Income: 2+ Races¹
Aggregate
Income: Non-Hisp White¹
Aggregate Income: Hispanic¹
Family Income
Families with Income <$10K
Families with Income $10K-$14,999
Families
with Income
$15K-$24,999
Families with Income $25K-$34,999
Families
with Income $35K-$49,999
Families with Income $50K-$74,999
Families with Income $75K-$99,999
Families with Income
$100K-$149,999
Families with Income $150K-$199,999
Families
with Income $200K+
Median
family income
Mean family income
Per capita income
Median nonfamily
income
Mean nonfamily income
Household Income by
Race/Ethnicity³
144 fields describing race and
ethnicity (white,
black, Native American, Asian, Hawaiian, Other, Multirace, Hispanic,
Non-Hispanic White) by household income level (<$10k, $10-15k, $15-20k,
$20-25k, $25-30k, $30-35k, $35-40k, $40-45k, $45-50k, $50-60k, $60-75k,
$75-100k, $100-125k, $125-150k, $150-200k, $200k+)
Family Income by
Race/Ethnicity³
144 fields describing race and
ethnicity (white,
black, Native American, Asian, Hawaiian, Other, Multirace, Hispanic,
Non-Hispanic White) by family income level (<$10k, $10-15k, $15-20k,
$20-25k, $25-30k, $30-35k, $35-40k, $40-45k, $45-50k, $50-60k, $60-75k,
$75-100k, $100-125k, $125-150k, $150-200k, $200k+)
Poverty Status:
Percent of Families in Poverty
Percent of Families
With Child<18 in Poverty
Percent of Families With Child<5 in Poverty
Percent of married couples in poverty
Percent of married couples in
povertyWith Child<18
Percent of married couples in povertyWith
Child<5
Percent of Female HH families in poverty
Percent of Female
HH families in povertyWith Child<18
Percent of Female HH families in
povertyWith Child<5
Percent of
People in poverty
Percent of People
<18 in poverty
Percent of Children<5 in poverty
Percent of Children 5-17 in poverty
Percent of People Age 18+ in poverty
Percent of People Age 18-64 in poverty
Percent of People Age 65+ in poverty
Percent of People in families in poverty
Percent of People in Unrelated
15+
¹ Not available at the ZIP Code level
² Not available at the MSA level
³ Available only at the tract level
*States, Counties, MSAs, Tracts, Block Groups, and ZIP Codes with income data fields are included with the United States Country Package (FREE with a Maptitude purchase) and with TransCAD. Income data by Congressional District are sold separately.
 State
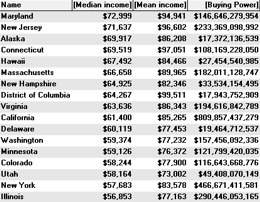
income and purchasing power data in tabular format.
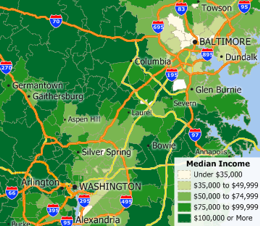
 A color
theme map of median income by ZIP Code created with Maptitude mapping software.
Home | Products | Contact | Secure Store