GIS Software for South Africa

A Geographic Information System (GIS Software) is designed to store, retrieve, manage, display, and analyse all types of geographic and spatial data. GIS software lets you produce maps and other graphic displays of geographic information for analysis and presentation.

Ad Maptitude is the lowest-priced, easiest-to-use professional GIS software available. For more information about Maptitude please visit our Maptitude Mapping Software pages. Otherwise, please read on to explore the GIS capabilities of Maptitude.

 Free Trial   Subscribe 

In this article:

What is GIS Mapping Software?

GIS software lets you produce maps and other graphic displays of geographic information for analysis and presentation. With these capabilities a GIS is a valuable tool to visualise spatial data or to build decision support systems for use in your organization.

What is gis mapping software?A GIS stores data on geographical features and their characteristics. The features are typically classified as points, lines, or areas, or as raster images. On a map, city data could be stored as points, road data could be stored as lines, and postal code boundaries could be stored as areas, while aerial photos or scanned maps could be stored as raster images.

Geographic Information Systems store information using spatial indices that make it possible to identify the features located in any arbitrary region of a map. For example, a GIS can quickly identify and map all of the locations within a specified radius of a point, or all of the streets that run through a territory.

In addition to the above capabilities, Maptitude implements a professional-strength relational database, a feature critical for GIS software. Attribute data may be freely joined to and detached from geographic layers and tables. Relational data manipulation is integrated with robust and powerful geoprocessing for spatial queries, polygon overlay, and other location-based analyses. This is supported seamlessly so that data are moved easily to and from relational tables and geographic databases. In addition, the Maptitude fixed-format binary table supports 32,767 fields and 1 billion records, and has unlimited character field widths.


Blog: Why 70% of Fortune 50 companies rely on Maptitude

 Start Mapping Now 

Geographic Information System Software Features

GIS Software Case Study

GIS Map Software

Maptitude is one of the most popular GIS software packages, and has extensive functionality. A list of typical GIS capabilities is presented below, and these are all available in Maptitude. 

GIS Maps and Layer Features

  • Create-a-Map Wizard: Easily create presentation-ready maps using your own data or default map templates
  • Display Manager: Customise GIS maps in real-time with on-the-fly adjustments
  • User Preferences: Configure GIS map settings such as units, left/right side-of-road routing, file permissions, geocoding parameters, and more
  • Toolbox Navigation: Navigate maps using intuitive mouse-based controls, including panning, zooming, and magnifying
  • Map Bookmarks: Save and retrieve custom GIS map views with ease
  • Multi-Layer Query Tools: Directly query spatial locations across multiple layers
  • Map Library/Manager: Organise saved GIS maps with access to a library of pre-styled demographic maps
  • Layer Customisation: Adjust layer visibility and drawing order with geographic database layering controls
  • Multiple Map Handling: Open, duplicate, combine, synchronise, tile, cascade, and minimise/maximise multiple GIS maps simultaneously
  • Map Scale Control: Precisely control scale with the ability to undo adjustments to created maps
  • Layer Autoscaling: Customise the scale at which layers are visible for enhanced GIS map clarity
  • Interactive map overview window: Provides perspective as you work and the ability to zoom anywhere in the GIS study region

Visualisation GIS Features

  • Extensive Layer Style Control: Customise fonts, styles, and opacity for points, lines, areas, labels, and legends. Support for most image formats with scalable resolution for point and area styles.
  • Thematic Visualisations: Apply colour, pattern, icon, dot-density, chart, scaled-symbol, and 3D prism themes for rich visual storytelling through your maps.
  • Customisable Drawing Tools: Personalize your GIS map with a variety of drawing items, including north-oriented arrows and other symbols.
  • Editable Legend: Automatically generate and edit legends to maps that reflect displayed features, including a live scale bar.
  • Charting Capabilities: Create a variety of charts, including pie, bar, line, area, scatter, radar, histogram, box plot, and function charts
  • Advanced Text Label Tools: Manage labels with automated positioning, callouts, rotation, font control, multi-line support, and more. Easily manipulate labels individually or in bulk.
  • Copy & Paste Functionality: Save GIS maps and graphics as images or bitmaps with adjustable resolution/quality for use in MS Office and other applications.
  • Printing Support: Print maps on any size paper with spatial print options, including fixed scale, actual point sizes, and pre-rendered images.
  • Report/Layout Creation: Customize reports with snap grids, rulers, margins, alignment, and automated district printing options available for GIS mapping projects.
  • Map Interaction Recording: Record GIS map interactions as video for presentations
  • Cartographic Colouring: Use Brelaz's Dsatur algorithm in GIS mapping to automatically assign unique colours to adjacent regions for clear, distinguishable visualisation.

Geocoding

  • Find Locations Anywhere: Use tabular and geographic tools to pinpoint locations globally.
  • Flexible Geocoding Tools: Support for unlimited geocoding by address, postal code, city, coordinate, and more, including manual input and geotagged images from GPS-enabled devices.
  • Custom Geocoding: Create custom indexes to geocode your GIS maps based on external datasets.

 Start Mapping Now 

GIS Mapping Tools and Geographic Analysis

Geographic analysis tools are the most valuable component of GIS software because they let you analyse the geographic components of your data. Below are some of the geographic analysis tools that are standard in Maptitude:

Territory Building Tools
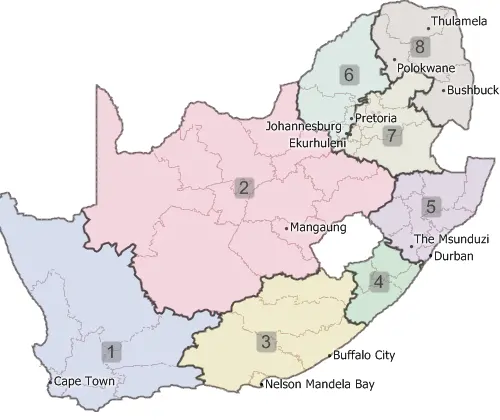
Maptitude GIS territory map with territories created from states and provinces using Maptitude GIS mapping tools

Districts/Territories can be created using map-based filters or via tabular groupings

Buffers

Maptitude GIS map of buffers around hospitals

Circular buffers/bands for analyzing proximity

Facility Location
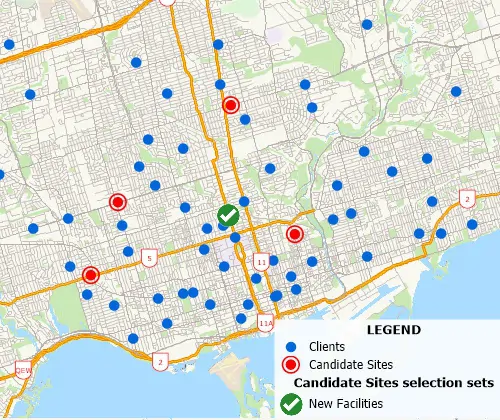
Maptitude GIS facility location results

A facility location tool identifies the best location for one or more facilities from a set of candidate sites

Hot Spots
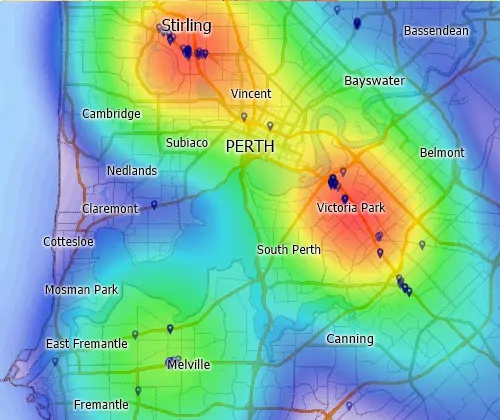
Maptitude GIS map of customer hot-spot in Perth, Australia

Kernel-based density grids can be created using the quartic, triangular, uniform, or count methods, and allow "hot-spot" mapping

Weighted Center
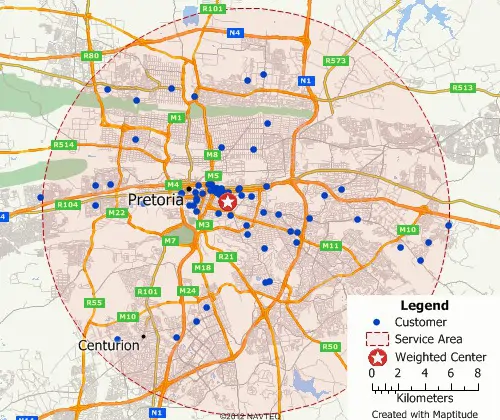
Maptitude GIS map of weighted center gravity location of customers in Sydney, Australia

Weighted center calculations allow the identification of centers of "gravity" among points

Shortest Path
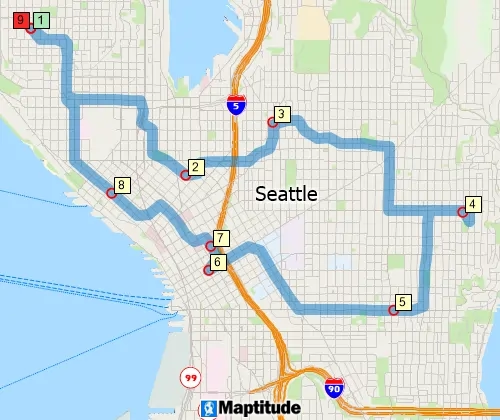
Maptitude GIS map of shortest path route returning to origin

The shortest path calculations allow for minimizing the cost of the path as an ordered/unordered route with options to produce directions and to return to the origin

Drive-time Bands
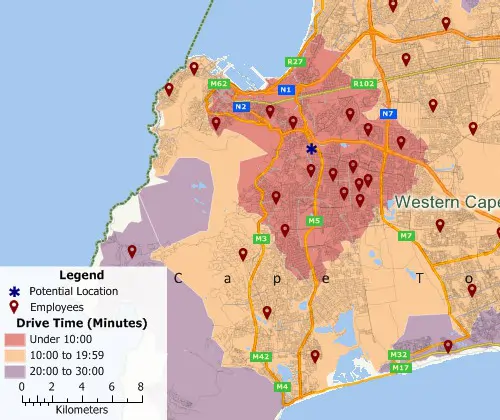
Maptitude GIS map of 10-minute drive time rings around two sites

Drive time/distance bands allow you to visualise the extent to which locations can be accessed within a certain drive time or distance

Drive-time Territories
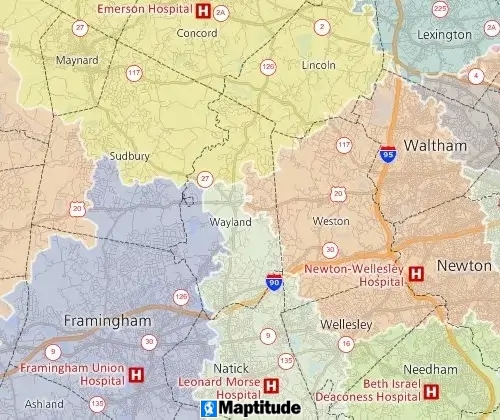
Maptitude GIS map of territories based on drive-time to nearest hospital

Drive time partitions allow regions across a line layer to be defined based on network cost

Clustering
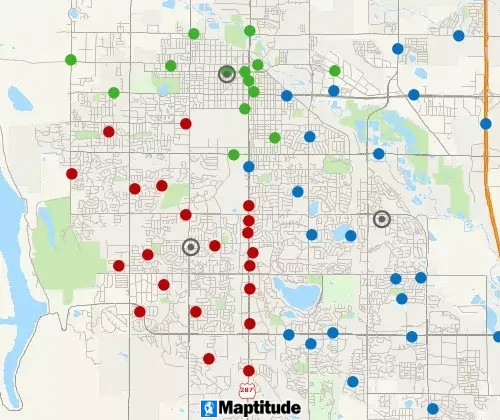
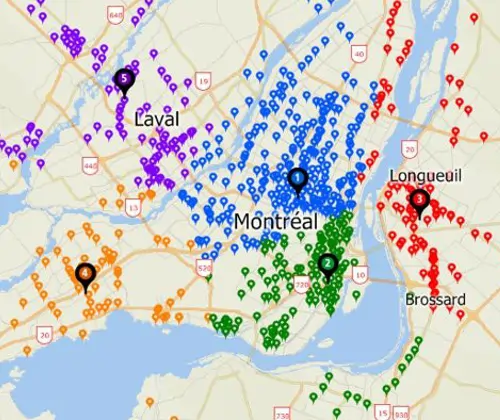
Maptitude map of customers clustered with a maximum number of units capacity

A clustering tool groups points or areas into compact clusters, while placing optional constraints on the clusters such as maximum size or a balanced total field, such as Sales or Population

Routing Deliveries & Pickups
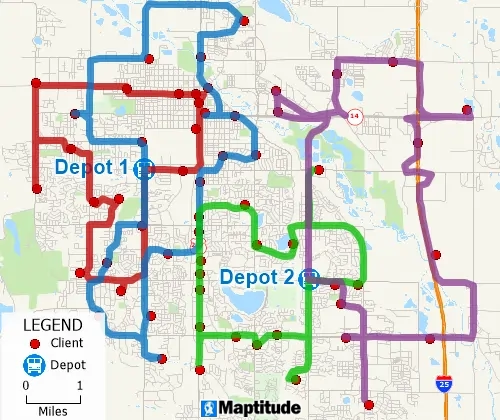
Maptitude map of delivery routes with time windows from two depots

Routing tools optimise routes for several vehicles needing to reach many destinations for deliveries and pickups in fixed time windows

Areas of Influence
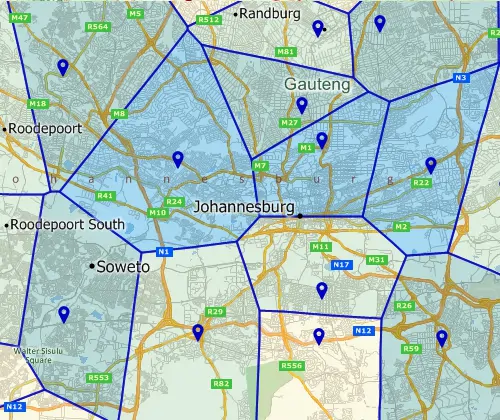
Maptitude GIS map of area-of-influence/Voronoi territories

Areas-of-Influence (also known as Thiessen Polygons or Voronoi Diagrams) are a powerful GIS tool that divide the study area using a triangulated irregular network (TIN)

GPS Support
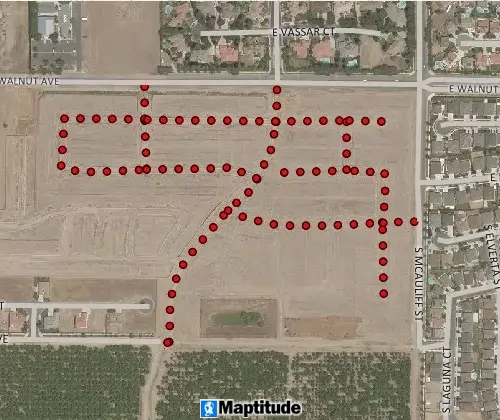
Maptitude GIS map of GPS playback data

GPS support includes the ability to read/animate/import GPS data, overlay tracks with aerial photos and topographic or vector maps, track real time GPS locations, create vector line/point layers from GPS playback files, and import/export formats such as GPX (the GPS Exchange Format)

Spatial Queries
Maptitude map with spatial query filtering customers to the nearest store

Filter features based on geographic location, proximity to other features, by radius, by pointing, by polygon, or based on a value or condition.

Statistical Analysis
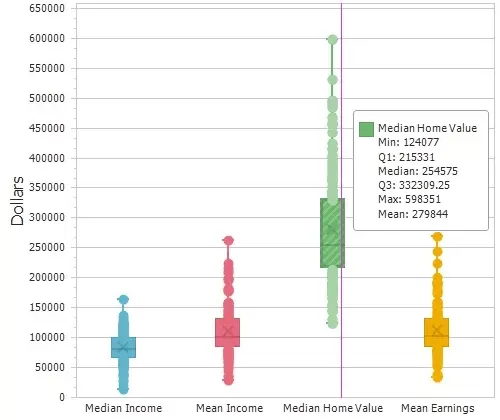
Maptitude box plot

Compute summary statistics (sum, min, max, mean, standard deviation), compute spatial autocorrelation, and create box plots, histograms, and radar charts.

Internet Mapping
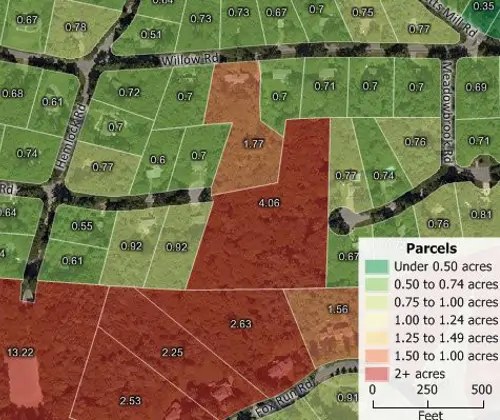
Internet mapping of parcel maps and data

SaaS applications such as Maptitude Online allow you to share your geographic data as device independent and mobile-friendly interactive maps. You can also add mapping functions to your web site such as providing the public with access to assessor parcel maps and valuation data.

 Start Mapping Now 

GIS Map Imaging Features

  • Image layer and aerial photo tools include registration, a manager/librarian, contrast control, smoothing (from 2x2 to 10x10) and interpolation (nearest neighbor, bilinear, high quality bilinear, bicubic, high quality bicubic)
  • The image servers supported are Google Earth and OGC Web Map Services (WMS)

GIS Map Database

  • The Maptitude GIS program has a powerful proprietary relational database
  • Support is provided for over 50 file types and more than 100 GIS and CAD formats, some natively including Excel, MS Access, ODBC, dBase, CSV, ASCII, ArcGIS platform formats (Esri Shapefile and Personal Geodatabase), MapInfo TAB, Oracle Spatial, and SQL Server Spatial
  • Support is provided for exporting to many formats including Excel, dBase, CSV, ASCII, Lotus, Google KML, ArcGIS platform formats (Esri Shapefile and ArcMap Document), MapInfo MIF, Oracle Spatial, SQL Server Spatial and AutoCAD DXF
  • Table tools include the ability to transpose, group/aggregate, identify duplicates, calculate statistics, convert longitude/latitude to XY coordinates, print mailing labels, copy/paste values, and perform undo/redo of edits
  • Regression and binary logit models can be estimated on any map layer or table
  • Table field tools include the ability to hide, show, filter, lock, format, multi-field sort, create live expression/formula fields, and perform multi-cell fills
  • Database modify tools include the ability to add/delete records/fields, delete filtered records, set aggregation rules, apply look-up table coding, and define field header balloon pop-up text
  • Database joins can be aggregate/non-aggregate and as one-to-one, one-to-many, or many-to-one joins
  • Multiple filters per layer or database can be created using SQL type queries, spatial queries (coincident, adjacent, within, and many more), and data classification methods
  • Topological/non-topological spatial databases can be created for points, lines, areas, or grids
  • Topological/non-topological layer (line/point/area) editing tools include the ability to use digitisers, create one-way streets, copy and paste lines, merge/split features/attributes, add/delete/move features, line/area conversion, point-to-line conversion, merging layers, clipping/masking geography by region/area, and undo/redo of edits
  • There is comprehensive projection, datum, and coordinate system support both natively and via import/export, and this operates in conjunction with tools such as vector rubbersheeting and on-the-fly raster layer reprojection
  • Any record can be linked to multiple files including photos, documents, web pages, and slide-shows

GIS Development Platform

  • The Geographic Information System Developer’s Kit (GISDK™) has 850+ Caliper Script functions that can be called to create add-ins, build custom applications, and to access Maptitude from .NET or as a COM Object

GIS Processing

Maptitude supports the latest 64-bit Windows operating systems, allowing users to take advantage of enhanced resolution and memory capabilities beyond the previous 4GB limit. This ensures the software is optimised for handling large GIS data files and spatial analysis tasks without performance loss.

  • Save to much higher resolution images
  • Use more memory than the previous 4GB 32-bit limit
  • Open/import files via 64-bit Microsoft Office (e.g. Excel and Access).

Minimum Requirements for Maptitude GIS Software

  • Versions: Install on a local Windows device such as a PC or Surface Pro; Or install on a Citrix or Terminal Services server or on a Windows device when accessing the software via Remote Desktop Protocol (RDP) or Remote Desktop Services (RDS).
  • Desktop or laptop computer running 64-bit Windows 11 or 10
  • Internet connection for download
  • Hardware: 4GB of RAM (8GB of RAM provides optimal performance for users with very large data files.) 10 GB of storage space for data. More space will be required to save the maps and files created.

GIS Mapping Software Cost

Maptitude GIS mapping software costs $695 annually and includes a FREE country package ($595 value) that includes an up-to-date street layer with addresses for pin-mapping (geocoding) and travel time information for computing routes and drive-time rings. Also included are building footprints for many urban locations, railroads, and comprehensive named landmarks that range from public facilities to commercial buildings including shops, restaurants, and retail stores. Postal data and detailed demographics (where available) are shipped with the product.

Benefits of GIS Mapping Software

  • Geospatial Data Insights: Uncover hidden trends and insights in your geographic data, spreadsheets, and databases to drive data-driven decisions.
  • Geospatial Analysis: Create 3D maps, heat maps, territorial analysis, drive-time rings, hotspot analysis, charts, and reports for advanced spatial visualisation.
  • Data Import & Analysis: Import, analyse, segment, and report on geospatial data in nearly any format for seamless GIS integration.
  • Location Intelligence: Filter, categorise, and analyse spatial data using location intelligence for better decision-making and actionable insights.
  • Location-Based Results for Efficiency: Print, export, manage, and share location-based results to improve workflow efficiencies and achieve cost savings through geospatial insights.

 Start Mapping Now 

Online GIS Software with Maptitude

Maptitude Online GIS software provides powerful tools to create, manage, and share maps and reports securely. Administrators can control access with secure login options, and maps can be shared privately (with usernames and passwords) or publicly (via URL). Public maps can also be embedded into websites or blogs using simple HTML iframe code.

Data can be uploaded in Excel or CSV formats, or added by copying/pasting or typing in addresses. Batch geocoding is supported, and users can create dynamic visualisations such as heat maps, colour themes, pie charts, and symbol or size-based themes. You can also add pushpins to addresses, postal codes, and cities.

Maptitude offers a wide array of interactive geospatial tools, such as drawing radii, buffers, circles, territories, and drive-time rings. Maps can be tailored by adding, hiding, or removing layers, spreadsheets, themes, labels, and analytics.

Key Online GIS Mapping Features

  • Secure Sharing: Share maps privately or publicly with login credentials or direct URLs.
  • Data Integration: Upload Excel or CSV files or manually add addresses for geocoding.
  • Dynamic Visualisations: Create heat maps, pie charts, and customised symbol or size themes.
  • Geospatial Tools: Draw buffers, radii, influence areas, and calculate weighted centers.
  • Interactive Mapping: Filter, query, and select features across map layers and data tables.
  • Territory Management: Create and visualise territories.
  • Map Editing: Modify maps by adding, hiding, or deleting layers, themes, and spreadsheets.
  • Export & Reporting: Export map images and generate demographic PDF reports.
Maptitude Online GIS Software

With comprehensive help and learning materials, and competitively priced subscription plans, Maptitude Online makes professional GIS mapping accessible and effective for individuals, teams, and organisations.

Frequently Asked GIS Mapping Questions

What is GIS?

A Geographic Information System or GIS is a computer system that allows you to map, model, query, and analyse large quantities of data within a single database according to their location. GIS gives you the power to:

  • Create maps
  • Integrate information
  • Visualise scenarios
  • Develop effective solutions
  • Present powerful ideas

GIS is a tool used by individuals, organizations, schools, governments, and businesses seeking innovative ways to solve their problems. GIS stores information about the world as a collection of layers that can be linked together by a common locational component such as latitude and longitude, postal code, census tract, or street address. These geographic references allow you to locate features on the earth's surface for analysis of patterns and trends. Dozens of map layers can be arrayed to display information about transportation networks, hydrography, population characteristics, economic activity, and political jurisdictions enabling you to identify trends that may otherwise be hidden.

What can GIS be used for?

Geographic information system (GIS) technology can be used for spatial data analysis and mapping, enabling sophisticated applications in urban planning, environmental science, epidemiology, and natural resource management. Its capacity to integrate diverse datasets enhances decision-making and promotes a nuanced understanding of spatial patterns and relationships.

GIS is a tool used by individuals, organizations, schools, governments, and businesses seeking innovative ways to solve their problems. Some specific examples of GIS applications include:

  • Census Geography
  • Transportation networks
  • Hydrography
  • Population characteristics
  • Economic activity
  • Political jurisdictions
  • Sales territory mapping
  • Route planning and deliveries

What is the best GIS software?

The best GIS software is subjective and depends on the user's needs and preferences. There are a variety of GIS software available, including open source and proprietary options. Some of the most popular GIS software include ArcGISQGIS, Maptitude, Global Mapper, and MapInfo.

Maptitude mapping software is widely considered to be the best GIS software for businesses due to its comprehensive features, affordability, and ease of use. It enables users to create sophisticated maps and analyse spatial data in a variety of formats. Its user-friendly interface allows users to quickly learn and master the software without being a GIS professional. It also offers powerful tools for data analysis, such as tools for querying, mapping, and reporting. Maptitude also provides support for many popular GIS formats, such as ESRI Shapefiles, GeoTIFFs, and Google Earth KML/KMZ files. Furthermore, it offers a range of advanced tools for data visualisation, including sales territory mapping and route planning and deliveries. All these features make Maptitude the best GIS software for businesses.

 Start Mapping Now 

VIDEO: Learn what Maptitude GIS Software can do for you

G2 ReviewsCheck out our G2 Reviews
4.7/5 of 140 reviews
4.7 stars

Related Articles

Find Us 1172 Beacon St., Suite 300
Newton MA 02461 USA

Home  |  Products  |  Contact  |  Secure Store

Copyright © Caliper Corporation