TransCAD is the most comprehensive, flexible, and capable travel demand modeling software ever created. TransCAD supports all important styles of travel demand modeling including sketch planning methods, four-step demand models, activity models, and other advanced disaggregate modeling techniques, and comes with the most extensive set of traffic assignment models ever assembled for use by planners and traffic engineers.
Many of the TransCAD enhancements and advantages come from improved algorithms and improved software engineering implementations of the best methods from the transportation science literature. Many key procedures in TransCAD are multi-threaded, resulting in enormous speed improvements on today’s multi-core processors. There is also support for distributed processing for the largest models.
TransCAD continually breaks new ground as a tool for transportation planners by improving, streamlining, and accelerating the demand modeling process. TransCAD is the only package designed to facilitate the implementation of best practices for travel forecasting and to provide a mechanism for advancing the state of the art in transportation modeling. Modeling with TransCAD is not limited to urban or regional demand forecasting, but is directly applicable for modeling passenger and freight flows at the state, national, and international level.
TransCAD software is unique among travel demand forecasting packages in many respects:
Travel forecasting models are used to predict changes in travel patterns and the utilization of the transportation system in response to changes in regional development, demographics, and transportation supply. Modeling travel demand is a challenging task, but one that is required for rational planning and evaluation of transportation systems.
TransCAD is the only modeling package that is GIS-based and fully integrates geographic information system (GIS) and demand modeling capabilities. TransCAD is an extremely capable and robust GIS that includes many advanced features for transportation that are not available in other general purpose GIS software products.
There are many reasons why it is valuable to have a GIS as an integral part of a travel demand forecasting package. First, GIS makes it possible for planning models to be much more accurate. For example, network distances are based on the actual shape of the road network and a correct representation of highway interchanges.
Second, the whole modeling process is more efficient. Data preparation is greatly facilitated and the database and visualization capabilities catch errors before they cause modeling problems. With TransCAD, you and others will have an easier time understanding how the model components behave. For all of these reasons, less staff time is needed to implement and maintain travel models.
A third important advantage of a GIS-based modeling system is the use of the GIS itself and GIS-derived measurements directly in the modeling process. In TransCAD, different modeling equations can easily be derived and applied for different geographic subareas. Similarly, TransCAD brings new and much-needed capabilities for measuring geographic accessibility.
Because they have similar architectures, TransCAD is the planning package that integrates best with other institutional GIS software systems. TransCAD has native support for Esri Personal Geodatabases, Access, Excel, and Google Earth. TransCAD can import data from virtually all major GIS, CAD, and planning software packages. TransCAD is an open system and can export data in ASCII, Shapefile, dxf, and Oracle Spatial formats. TransCAD also links easily to ArcGIS, Google Earth, MapInfo, and Maptitude.
TransCAD includes comprehensive tools for trip generation, trip distribution, mode split modeling, traffic assignment, and all related matrix and network processes. TransCAD includes all of the traditional 4-step models and significant variants, quick response models with reduced data requirements, and advanced disaggregate demand models. Caliper continually enhances TransCAD to incorporate the most up-to-date methods for demand forecasting.
The goal of trip production is to estimate the number of trips, by purpose, that are produced or originate in each zone of a study area. Trip generation is performed by relating frequency of trips to the characteristics of the individuals, of the zone, and of the transportation network. There are four primary tools for modeling trip production, all of which are provided in TransCAD:

The goal of Trip Attraction is to predict the number of trips attracted to each zone or to a particular land use. In many ways, estimating attractions is similar to estimating trip productions. Thus, cross-classification, regression, and discrete choice methods can be used to estimate the number of trips attracted to a zone. TransCAD also includes Institute of Transportation Engineers (ITE) trip rate data for calculating trip attraction values for a single land use or mixed land uses.
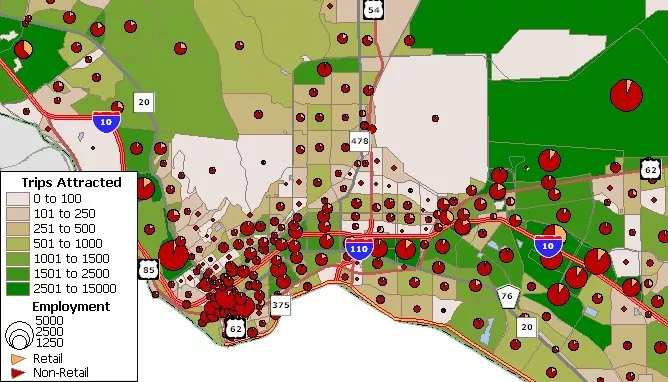
In trip generation, separate models are used to predict productions and attractions. This invariably leads to a discrepancy between the number of intraregional trips produced in an area and the number of trips attracted to an area. To conserve trips, balancing methods are provided so that the number of attractions equals the number of productions. Trip generation and attraction can be balanced flexibly to productions or attractions or a linear combination thereof.
Trip distribution models are used to predict the spatial pattern of trips or other flows between origins and destinations. Models similar to those applied for trip distribution are often used to model commodity flows, retail trade, and store patronage.
TransCAD provides numerous tools with which to perform trip distribution, including procedures to implement growth factor methods, apply previously-calibrated gravity models, generate friction factors, and calibrate new model parameters.
In addition to doubly constrained trip distribution models that ensure that the output flow matrix from trip distribution matches the input productions and attractions, TransCAD includes tri-proportional models which allow for another dimension of constraints. In tri-proportional models, groups of cells in the P-A flow matrix are required to sum to specified values. TransCAD allows the additional dimension to be applied for both growth factor and gravity models.
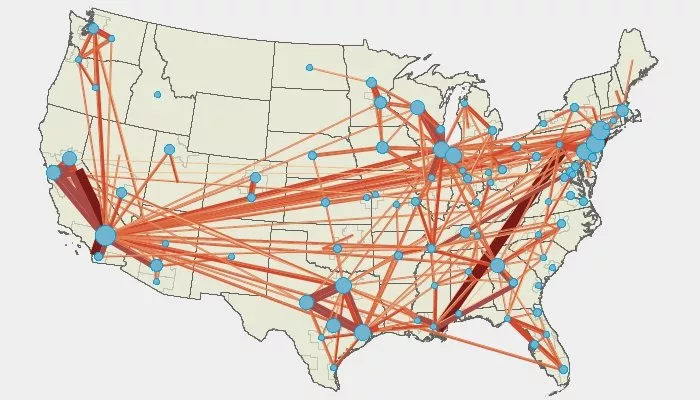
Mode choice models are used to analyze and predict the choices that individuals or groups of individuals make in selecting the transportation modes that are used for particular types of trips. Typically, the goal is to predict the share or absolute number of trips made by mode.
An important objective in mode choice modeling is to predict the share of trips attracted to public transportation. TransCAD provides procedures for calibrating and applying mode choice models based on multinomial and nested logit models, as well as legacy methods, and may be pursued at either a disaggregate or aggregate zonal level.
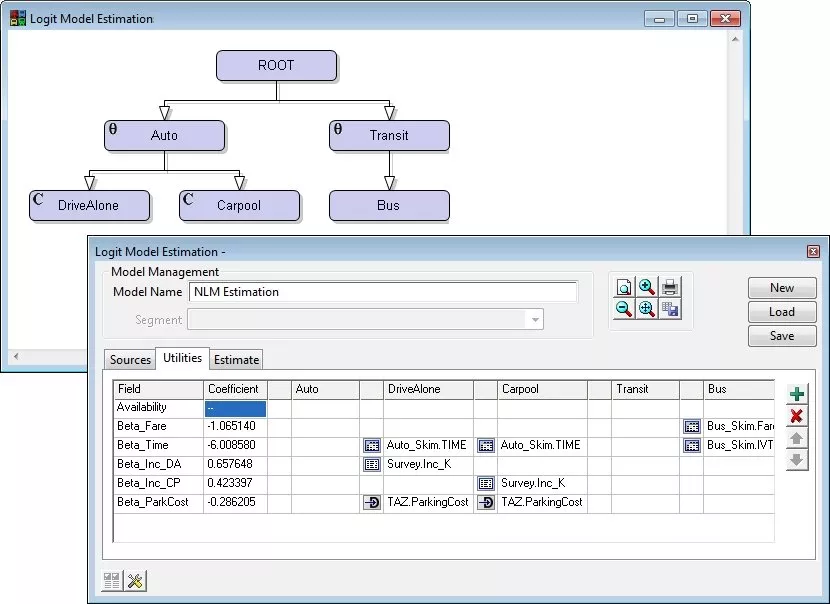
Estimation of the parameters in the nested logit and multinomial logit model is performed in TransCAD by the method of maximum likelihood, which calculates the set of parameters that are "most likely" to have resulted in the choices observed in the data. There is enormous convenience in estimating and applying nested logit models in the same software environment.
A special interface lets you draw the structure of your nested logit model graphically. A companion model management window helps setup the utility functions and data sources. With this interface, estimating nested logit models has never been easier.
TransCAD supports choice set variation in both estimation and model
application which is important for accurate model specification.
TransCAD also provides support for coding user-defined mode choice
procedures in FORTRAN, C, JAVA, and
C++.
TransCAD includes comprehensive tools that enable you to:
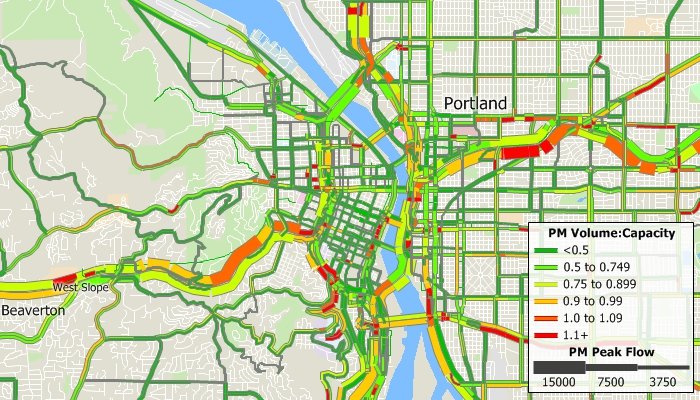
TransCAD incorporates several breakthroughs in traffic assignment methodology that facilitate more accurate analyses of road traffic and the impacts of transportation improvements. All of the user equilibrium methods can achieve very high levels of convergence and do so with unprecedented fast computing times. Also, most of the methods take advantage of multi-threading to run much faster on multi-core and multi-CPU computers.
The advanced methods include:
There is also an interface to running SATURN traffic assignments and preparing SATURN data for SATURN users.
Multi-Modal, Multi Class Assignment
Among the advanced methods is a very flexible, master multi-modal, multi-class equilibrium
or stochastic equilibrium assignment model that accommodates realistic multi-class entrance
to exit tolls in addition to traditional link tolls. This is a generalized cost assignment
that uses class specific values of time and network use restrictions. A wide array of
volume-delay functions have been pre-programmed and there is provision for user written
functions as well.
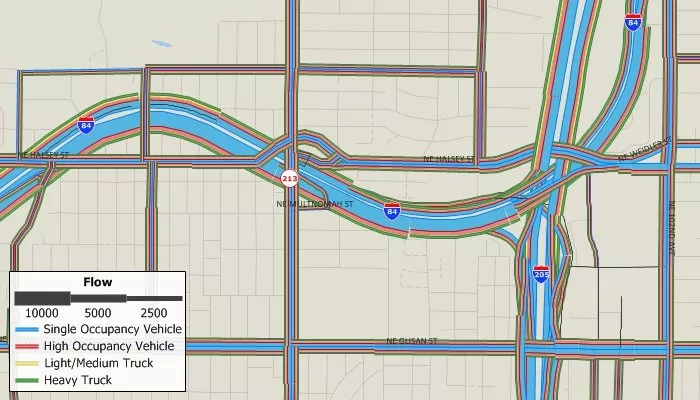
Level of Service (LOS) Calculators
TransCAD includes several modules for performing intersection LOS calculations
and calculating related HCM measures. These are very convenient to use as no data
transfer is required.
Origin User Equilibrium
Origin user equilibrium (OUE) can achieve much higher levels of convergence in less
computing time than traditional assignment algorithms. Caliper’s version can also
compute new solutions using a "warm start" from prior solutions which reduces the
time needed to perform impact assessment and to achieve feedback convergence. Also
select link analysis can be performed without having to rerun the assignment. OUE
supports all of the features of the multi-modal, class toll road assignment method.
Equilibrium Assignment with Volume Dependent Turning Delays
For more realistic treatment of networks with traffic signals, TransCAD
has a traffic assignment with HCM delay models for both signalized
and unsignalized intersections so that mixed networks can be modeled.
There is a convenient intersection editor, shared with Caliper’s
TransModeler traffic simulator, that reduces the effort required to
specify intersection geometry and signalization.
Dynamic Equilibrium Traffic Assignment
Standard traffic assignment models treat both the O-D demand and network
capacity as fixed and unvarying over a given time period. These models
also assume that all trips in the O-D matrix are completed within the
same time period. In reality, the temporal distribution of demand over
the period can vary greatly, leading to various levels of flow and
congestion. In addition, some O-D trips are longer than the assignment
time period, leading to potentially misleading results. The TransCAD
Dynamic Traffic Assignment (DTA) model addresses these problems by
dividing up O-D departures by time period, assigning O-D trips by time
period, and effectively managing the interaction of trips introduced to
the network at differing time periods. The flow and congestion results
are often more realistic than the standard traffic assignment models,
and capture the temporal distribution of congestion on the network more
effectively. There is also an option to modify the capacity of one or
more links to capture the effects of incidents and work zones.
This DTA for planners can run on very large networks, includes calculation of spillback queue delay, and can generated congested skims that vary by departure time for time of day and activity models. It has important applications in evacuation planning and in preparing trip tables for traffic simulation. Other DTA models are available in TransModeler.


Screenline Analysis: Screenline analysis compares the results of trip assignment with the traffic counts on roads. More precisely, it is a process of comparing the directional sum of ground count traffic volumes across a screenline or a cordon line with the directional sum of the assigned traffic volumes across the same screenline or cordon line. Screenline analysis is a useful tool for the calibration of trip assignment models, and it can also be used for more general purposes of calculating flows that cross a screenline.


Subarea Focusing: While forecasting transportation demand for a region, you may be interested in performing a more detailed investigation of traffic patterns within a subarea, such as the downtown area. To facilitate subarea analysis, TransCAD provides a procedure that lets you create an O-D trip table for any subarea. The reduced O-D table may be used for performing a traffic assignment on a subarea network which may be more detailed than the regional network, or used in a traffic simulation for the subarea.
Assignment Differences: You can compare two flow tables to find assignment differences. The assignment differences utility creates a theme that graphically illustrates the locations and magnitudes of differences. This tool is particularly useful for analyzing the effects of changing network attributes, such as capacity or VDF parameters, or employing different assignment techniques.
Select Link/Zone Analysis: You can create an origin-destination matrix file that indicates the number of trips that pass through a specified set of links or zones, sometimes referred to as critical links or critical zones. You can also create an assignment table that contains the component of flow on links that pass through a specified set of links or zones.
Public transit is a specialty of TransCAD, with capabilities that greatly exceed those of other planning packages. TransCAD is the only software that has a realistic GIS-based representation of transit systems. TransCAD has special data structures for handling transit routes in all their natural complexity. Routes may be stored, displayed, edited, and analyzed. An important feature is that transit routes can be directly placed on the streets so that interactions between autos and transit can be treated explicitly. Moreover, stops need not be located at street intersections, but instead can be located where they really are and on the correct side of the street.

Special visualization capabilities for transit make it easy to display and label overlapping routes. There is an effective interactive route editor that makes it straightforward to enter new routes and modify existing ones.
TransCAD has the broadest set of transit pathfinding routines of any package and includes the methods found in other packages. The latest version has a new, generalized pathfinder that computes composite characteristics for overlapping transit routes. This pathfinder improves upon the UTPS, TRANPLAN, TP+, and EMME/2 methods and gives a good estimate of the waiting time that travelers would experience prior to boarding a transit route in the presence of overlapping service.
There is also the broadest set of transit assignment methods including some innovative methods not found in other packages. These include a stochastic user equilibrium method that deals with multiple service alternatives, vehicle capacity, and optionally with dwell time and user’s value of time. In New York City, the transit agencies have been using TransCAD for nearly two decades because of these advanced capabilities.
TransCAD has special tools and procedures for creating and working with transit networks. Transit fares can be specified as flat, zonal, or mixed. Using transit networks and fare structures, you can solve shortest path problems, calculate transit path attributes (i.e. skims), and perform transit assignment.
TransCAD can process schedules and assist in developing network attributes such as route headways.
TransCAD includes the most realistic and flexible transit pathfinding and skimming methods. The key methods provide the multiple paths that travelers will use and give the analyst fine control over access, egress, and transfer properties.
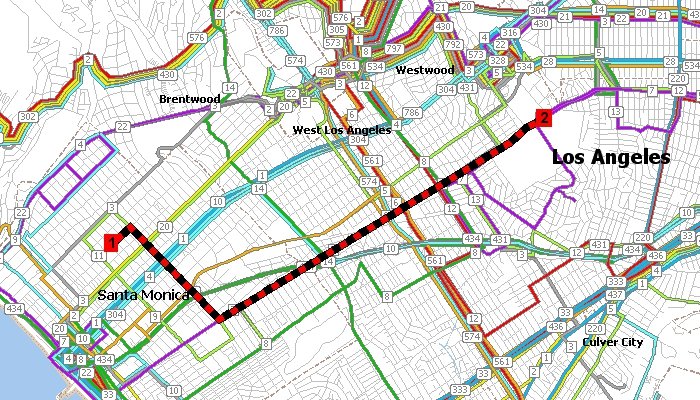
Transit assignment models are used to estimate the number of passengers that utilize segments in a transit network as a function of transit level of service. These models take as input a matrix of passenger flows between origins and destinations and a transit network, and produce link level and aggregate ridership statistics. TransCAD includes an array of sophisticated transit network assignment procedures.
These procedures include methods that are sensitive to fares and park and ride access, as well as equilibrium assignments, which take account of the capacity of transit service and the effect of ridership on crowding, comfort, and, optionally through dwell time effects, on the travel time on the route. These methods distribute the flow between a particular origin and destination to multiple paths, based on their relative attractiveness.
The transit assignment procedures produce a table of ridership at every stop along each route in the transit network. Optional outputs include critical link analysis, boarding and alighting counts, stop-to-stop flows, route-to-route transfers, and aggregate ridership counts. You can also save the paths utilized and visualize them directly.
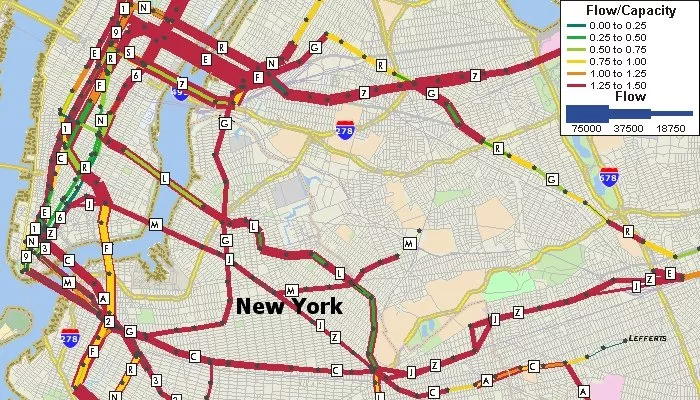
With TransCAD you can have separate and fully integrated networks for bicycles and pedestrians. Pedestrian links can be full street networks. Walk links can be included in transit networks.
Accurate and up-to-date trip tables are critical inputs for transportation planning models. Traditionally, the principal method of collecting information on the spatial pattern of trips within urban areas has been the large scale home interview survey. Unfortunately, home interview surveys of the necessary sample size are prohibitively expensive and difficult to implement, and are therefore rarely done. In contrast, traffic counts on highway links are inexpensive to perform and are routinely collected in many areas. It is thus extremely attractive to have a method to create or update trip tables based upon traffic counts.
TransCAD provides very flexible and effective procedures for estimating and/or updating an origin-destination matrix based upon a sample of network link traffic counts and an optional, initial or base trip table.
TransCAD has been designed to facilitate freight demand modeling as well as passenger models. TransCAD can manage all of your freight data no matter how many origins, destinations, shipments, or commodities are involved. TransCAD offers a complete solution for modeling commodity flows and truck movements. Freight traffic can be easily assigned to the transportation network and there are also specialized assignment procedures available for rail waybill assignment.

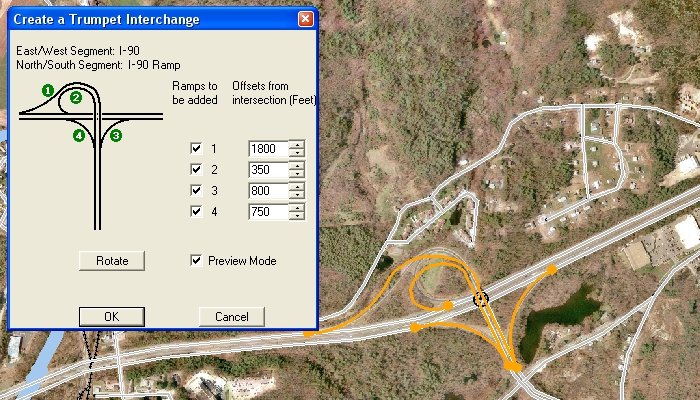
Advanced editing tools provide an effective means of improving the geography and topology of planning networks that may originally have only simple, straight-line representations. Specifically, TransCAD includes tools for:
Consequently, planning networks can now be fully realized as GIS entities and visualized directly with appropriate accuracy, shape, geometry, and directionality. Many users will find these tools indispensable for transforming TIGER/Line layers into a suitable basis for planning and traffic applications as well as for improving the line layers that are used for other types of transportation, including rail, transit, and air networks. In addition, all of these operations can be undone and redone at will.
TransCAD includes utilities that model developers will find indispensable for data preparation.
Geocoding: Virtually all forms of survey data can be analyzed in TransCAD. For most modeling purposes, each survey will be geocoded to the respondent's primary location. For traveler surveys, each survey will most commonly be geocoded to their residence.
Access Census Data Directly: Census data are very valuable in urban transportation analysis. TransCAD comes with extensive Census data. TransCAD also provides procedures for importing specialized Census data. There are procedures for importing data from the Census Transportation Planning Package (CTPP). The CTPP data are among the most valuable datasets available for transportation planners. There are also methods for accessing the American Community Survey (ACS) which provides the most up-to-date Census information available.
There is also a procedure provided for accessing the Public Use Microdata Samples (PUMS). PUMS contains complete household records from the US Census for a sample of the population, and is a valuable source of disaggregate data. The TransCAD procedure organizes the data so that you can open PUMS files directly and view the data either by household or by individual.
A World of Data: Increasingly there are many other data sets available for use with TransCAD for many other countries and regions. Caliper can help you identify these data sets.
Import Networks and Trip Tables: TransCAD provides tools for importing networks and network data from a variety of stand-alone transportation planning packages. These networks are converted into GIS databases that can be used for all types of planning, modeling, and mapping applications. TransCAD provides a seamless import capability for transportation planning network files in TP+, EMME/2, TRIPS, QRSII, TMODEL and TRANPLAN ASCII formats, usually with no preprocessing necessary. Other data can be imported from ASCII and many other formats.
TransCAD provides a wealth of facilities for building integrated model applications, performing scenario management, creating custom user interfaces for planning models, and running demand models without user intervention (i.e., in batch mode). In addition to running models interactively, TransCAD provides great flexibility in building complete model applications, with attractive user interfaces that are easy to learn and use. Models can be compiled and published or distributed to third parties with their key properties locked down to protect inappropriate modifications.
TransCAD comes with its own scripting language, GISDKTM, the GIS Developer’s Kit. GISDK is a simple object-oriented scripting language that provides hundreds of powerful modeling and GIS functions. GISDK includes a compiler and a debugger and provides all the tools needed to create model scripts, build add-ins to automate repeated actions, or create custom applications. TransCAD can also be scripted with Python and called from any .NET language.
Innovative Interactive Batch Capture
There is an innovative batch processing system that is built in to
TransCAD. In addition to creating scripts the old fashioned way by
writing them from scratch, TransCAD lets you create scripts
interactively by clicking menu items, choosing parameters in dialog
boxes, and saving the corresponding script. This can then be edited
further in the conventional manner.
Caliper also provides templates for common modeling streams including feedback so that you can adapt the templates for your own purposes. The GISDK and the batch facility let you create beautiful Windows user interfaces for your models.
User Friendly, Push Button Model Interfaces and Scenario Manager
For most planning models, Caliper offers a pre-designed model user
toolbox interface that can be easily modified for your model. The Model
User Interface Toolbox provides a custom interface that allows you to
run a model with the click of a button, as well as provides features to
store and create scenarios. You can generate and store any number of
scenarios. Scenarios are defined by a scenario name, a set of input
files, output files, and model parameters, and there are special
features in the toolbox to assist in setting up scenarios. Once you have
setup a scenario, the model steps for a scenario can be run separately
or run as a group. With a click of a button you can graphically view
model outputs and scenario differences.
TransCAD Model Manager
The TransCAD Model Manager is a graphical environment for building
integrated travel demand planning models and running scenarios. The
Model Manager allows you to create, understand, and edit planning models
based on a flowchart interface. It also provides a wide variety of
advanced scenario management tools.
With the model manager, you can interactively specify the order of the modeling steps to be performed, select all of the input and output files, and edit the model procedure parameters. The easy-to-use interface also documents the model and its components, and makes it simple to set up distributed processing.
Scenario Management
The model manager includes a powerful scenario management facility.
Once you have a working model, you use the Scenario Toolbox to organize the parameters for different runs of the model and to run the scenario. The Scenario Toolbox is the control panel for creating new scenarios, for editing and reviewing their parameters (input and output data files), and for running the model under different scenarios.
Object-oriented methods are used to maintain the relationships among sets of interrelated scenarios. Each scenario allows use to define the base directory that the model files use and optionally all the relevant input and output file names and parameters for the scenario. Additionally, sub or "child" scenarios can be created that is a subset of another scenario. The child scenario by default inherits all parameter values from its parent. Whenever the parent scenario's parameters change, the child's values change automatically greatly streamlining the model process.
Home | Products | Contact | Secure Store