Analysis Tools

Unearth the trends and information hidden in your data

One of the best reasons to use a GIS is to unearth and analyze the geographic components of your data. In addition to the sophisticated TransCAD transportation planning tools, you can use the included network analysis and geographic analysis tools to answer geographic questions. You can also integrate census statistics with your own data to identify geographic characteristics that impact you and your operations. You will be amazed at how quickly you can enhance your decision making using this easy-to-use GIS tool.

Network Analysis Tools

Network analysis models are used to solve many types of transportation network problems:
  • Shortest path routines can be used to generate the shortest, fastest, or least-costly route between any number of origins and any number of destinations, with any number of intermediate points.
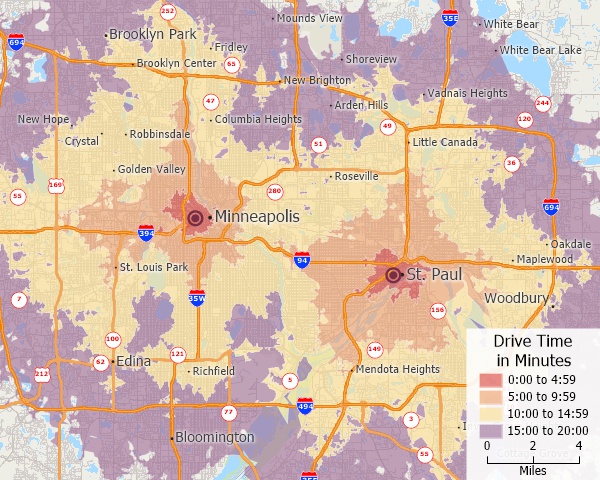
  • Network partitioning can be used to create service districts based on accessibility, perform drive-time analysis, or evaluate possible facility locations. When you perform network partitioning, you can also calculate the network distance or travel time from specific locations.
  • Drive-time and distance rings can be used to visualize the accessibility of features to a population.
  • Vehicle routing procedures can be used to optimize routes for several vehicles needing to reach many destinations for deliveries and pickups in fixed time windows.
  • Arc routing can be used to find efficient ways to service a set of links in a network while minimizing the amount of deadheading. Arc routing applications include street sweeping, solid waste collection, snow plowing, mail delivery, and other door-to-door operations.
TransCAD network band map with 5-minute interval drive-time rings

Five-minute interval drive-time rings around two locations
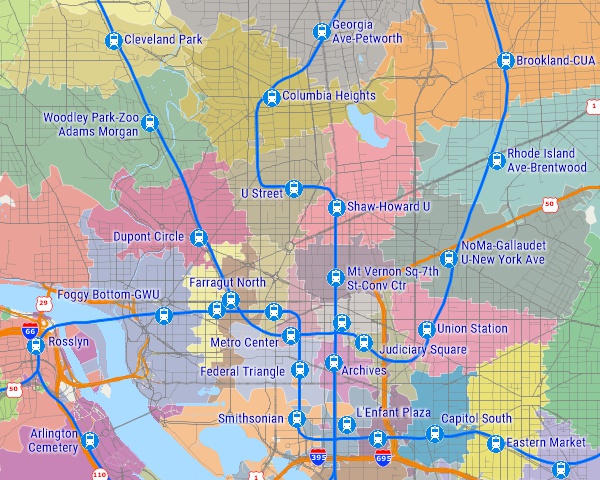
TransCAD map of Washington DC divided into areas based on walk distance to metro station

Territories based on walking distance to nearest subway station

TransCAD traveling salesman shortest path map

Shortest path route that visits multiple stops and returns to an origin
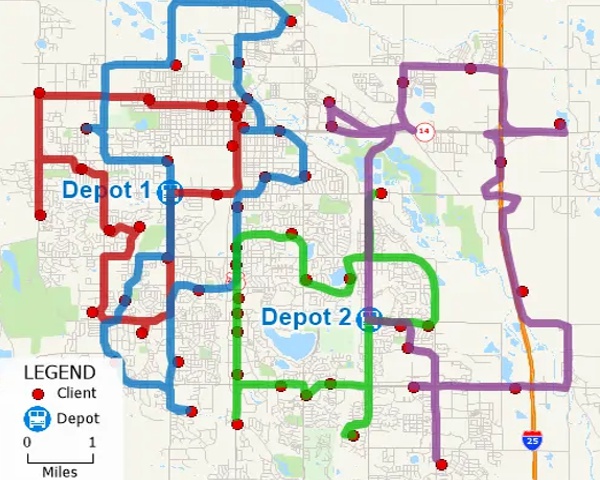
TransCAD map of fleet routing

Vehicle routes from two depots to multiple stops that account for vehicle capacities, cost, and delivery time windows
Geographic Analysis Tools

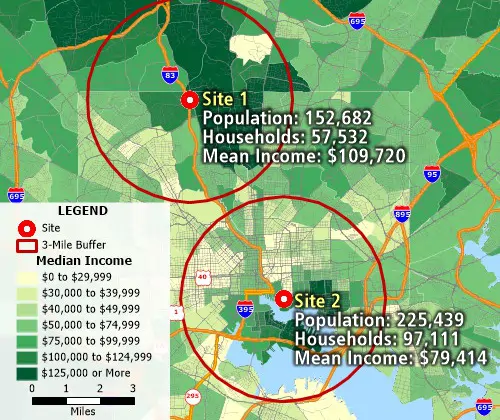
TransCAD ring map with calculated attributes

Rings (Buffers/Bands)

Create rings around any number of map features and then analyze the characteristics of those areas. Find out how many people live within a certain distance of a transit stop, compute the demographics around sites, or find the neighborhoods most affected by highway noise pollution.
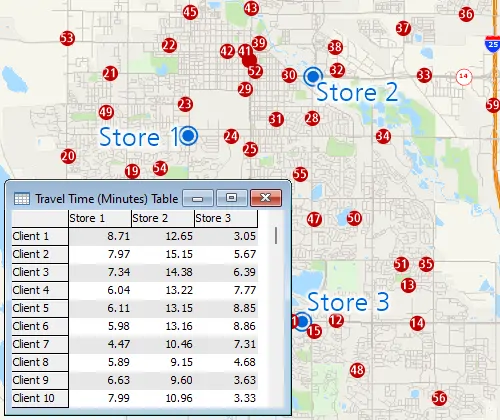
TransCAD map of customer locations filtered by the closest store to the customer

Measuring Tools

Create a table that shows the drive time or distance, or Euclidean straight-line distance, of features from one or more origins to one or more destinations.
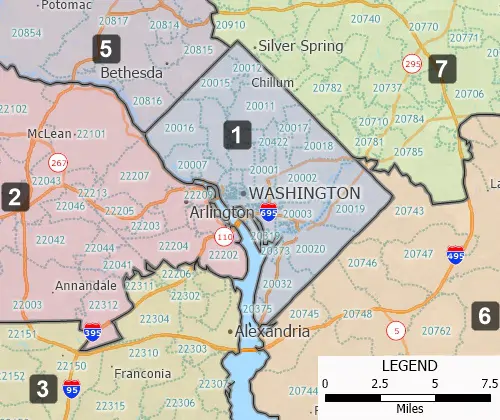
TransCAD custom territory map

Territories

Create territories based on a table or Excel spreadsheet, interactively by clicking on features in a map, or manually by drawing whatever boundary lines you require using the editing tools.
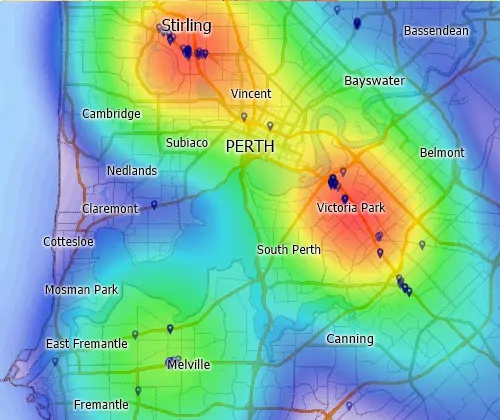
TransCAD heat map of customer concentrations

Hot Spots/Heat Mapping

Visualize point data by transforming the points into a regular grid to identify hot spots and weight the grid based on a value you choose.
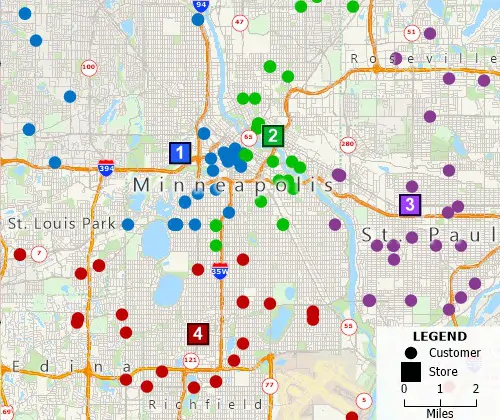
TransCAD map of customer locations filtered by the closest store to the customer

Spatial Queries/Filtering

Filter features based on geographic location, proximity to other features, by radius, by pointing, by polygon, or based on a value or condition.
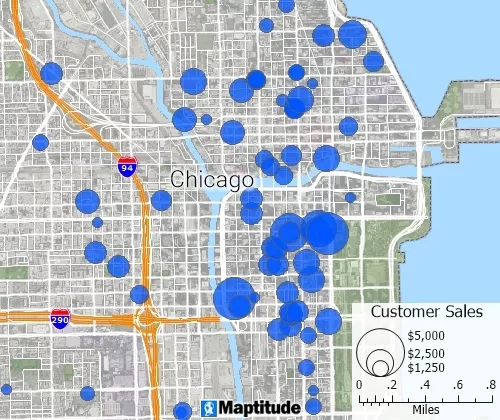
TransCAD map of geocoded customer locations

Geocoding Tools

Create pin maps by address, postal code, coordinate, and more for unlimited numbers of records.
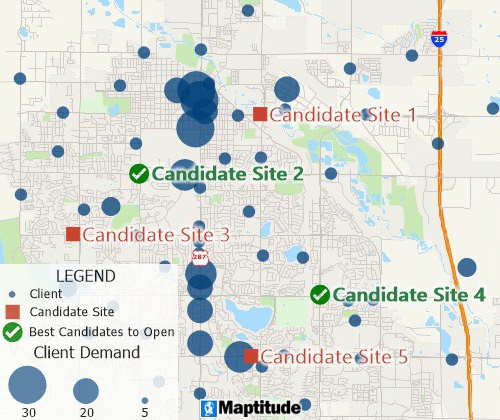
Mapping tools for identifying suitable facilities

Facility Location

Find suitable locations that provide a high level of service and minimize operating costs.
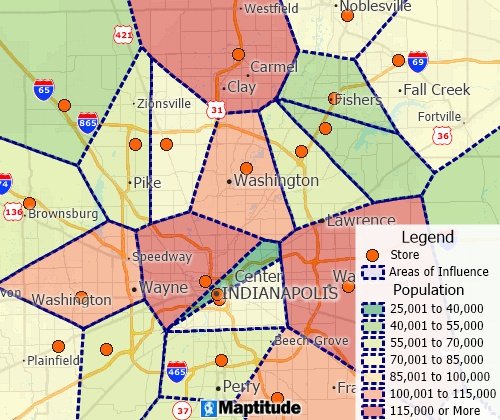
Thiessen mapping tools create straight-line distance territories
Areas of Influence

Thiessen polygon/Voronoi diagram map tools can create straight-line distance territories

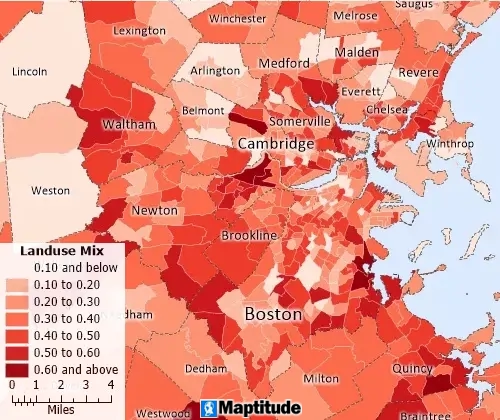
Maptitude map of land use mix by neighborhood

Land Use

Measure walkability and land use mix, to assess equitable access to services, amenities, and jobs
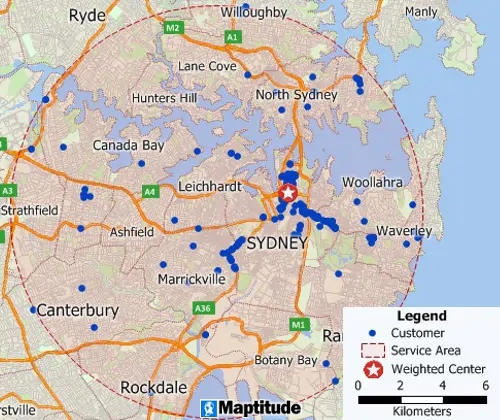
Maptitude GIS map of weighted center gravity location of customers

Weighted Center

Weighted center calculations allow the identification of centers of "gravity" among points
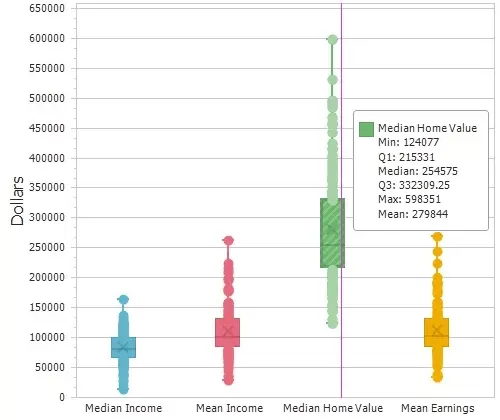
Maptitude box plot tool looking at home values and earnings

Statistical Tools

Compute summary statistics (sum, min, max, mean, standard deviation), compute spatial autocorrelation, and create box plots, histograms, and radar charts
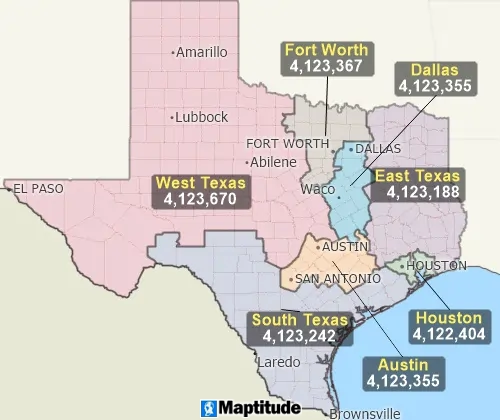
Maptitude map of territories automatically created and balanced by population

Territory Balancing

Partitioning and balancing tools that automatically attempt to produce contiguous, compact, and balanced territories

In addition you can:

  • Measure areas and distances
  • Aggregate and disaggregate attribute data
  • Cluster features into compact groups
  • Create areas from line features or lines from area features
  • Filter features based on level of adjacency
  • Create lines from a series of point features
  • Identify neighbors to an area of interest and create bands of adjacent neighbors
  • Analyze and display surfaces on a 3D map

Also from Caliper:

Maptitude contains many geographic analysis tools if you do not require the advanced transportation planning modules and utilities in TransCAD.

Find Us 1172 Beacon St., Suite 300
Newton MA 02461 USA

Home  |  Products  |  Contact  |  Secure Store

Copyright © Caliper Corporation